Medical Diagnosis
Vol.
13
No.
02
(
2023
), Article ID:
68261
,
13
pages
10.12677/MD.2023.132035
基于高斯拟合的第二心音分裂评价方法
刘超,刘熠辉,何勇,刘智,张宇欣,何杵壕,曾文华,贺家俊
湖南理工学院信息科学与工程学院,湖南 岳阳
收稿日期:2023年3月22日;录用日期:2023年6月23日;发布日期:2023年6月30日

摘要
鉴于利用第二心音主动脉瓣关闭(A2)和肺动脉瓣关闭(P2)的时间间隔检测心音分裂程度易受心跳影响而使检测精度低,本研究提出一种基于高斯拟合的第二心音分裂系数( )用于检测第二心音分裂评估新方法。其主要贡献如下:① 基于高斯拟合的A2和P2统计量的评估方法;② 基于高斯成分重叠率(OLR)的第二心音分裂系数( )定义。本研究通过对标准和临床数据库的2908个心音周期进行分析,在总体精度为1的前提下,得 统计和分裂对应关系为: ,且 为异常分裂; ,且 为正常分裂; 为单一无分裂第二心音。
关键词
第二心音,第二心音分裂系数,高斯拟合,重叠率

Anovel Evaluation Method of S2 Split Based on Gaussian Fitting
Chao Liu, Yihui Liu, Yong He, Zhi Liu, Yuxin Zhang, Chuhao He, Wenhua Zeng, Jiajun He
School of lnformation Science and Engineering, Hunan Institute of Science and Technology, Yueyang Hunan
Received: Mar. 22nd, 2023; accepted: Jun. 23rd, 2023; published: Jun. 30th, 2023

ABSTRACT
Due to the fact that the time interval ( ) between the sounds produced by aortic valve closure (A2) and pulmonary valve closure (P2) can be easily influenced by the heartbeat, it cannot accurately judge the second heart sound split (S2). This study proposes a novel evaluation methodology for detecting the wide splitting of S2 using the second heart sound splitting coefficient ( ) based on Gaussian fitting. The main contributions are as follows: ① An evaluation method of A2 and P2 statistics based on Gaussian fitting; ② A definition of the second heart sound splitting coefficient ( ) based on the Gaussian components overlapping rate (OLR). This study analyzed 2908 heart sound cycles from standard and clinical databases. Based on the overall accuracy of 1, the statistics and splitting corresponding relationship is that: if and it is an abnormal split; if and it is a normal split; if it is a single S2 with no splitting.
Keywords:S2, , GMM, Overlapping Rate

Copyright © 2023 by author(s) and Hans Publishers Inc.
This work is licensed under the Creative Commons Attribution International License (CC BY 4.0).
http://creativecommons.org/licenses/by/4.0/


1. 引言
第二心音(S2)由心室收缩末期主动脉瓣关闭(A2)和肺动脉瓣关闭(P2)两种心音产生 [1] [2] 。A2通常在P2之前关闭,这会产生一个在医疗界被称为“分裂”的时间延迟。若使用A2和P2之间的时间间隔( )衡量分裂程度,则通常在 小于30 ms时确定其为生理性分裂 [3] [4] , 在吸气时延长,在呼气时缩短,会引起S2的一种异常分裂——宽分裂。因此,S2分裂的检测能为医生提供科学且准确的医疗工具来帮助他们对病人进行诊断。目前可以将确定S2宽分裂的有效研究分为两类:第一类使用小波变换(WT)来表征S2的尺度分布,然后用时间指数局部最大值计算时间间隔 ,其典型图例在研究 [4] 中。
小波变换可以克服短时傅里叶变换中存在的时频权衡问题并避免在使用维格纳威利分布来分析非平稳信号时产生交叉项 [5] [6] 。然而,在运用这种方法计算S2中 区间时,必须解决如下问题:① 如何在给定的心音中确定S2;② 如何确定A2和P2在给定的S2中的位置;③ 如何根据 确定S2分裂,因为即使是S2生理性分裂 [7] 也会受到吸气和呼气影响。第二类基于瞬时频率(IF)与时频表示(TFR)相结合的平滑伪维格纳威利分布(SPWVD)来定位A2和P2持续时间,然后计算时间间隔 和A2到P2的瞬时频率能量比,最终准确确定A2和P2 [8] 。其计算S2分裂、A2和P2持续时间的方法如 [8] 中的图3所示。然而,在使用这种方式计算S2中时间间隔 以确定分裂类型时,仍存在以下问题:① 需要确定S2采集于吸气阶段还是呼气阶段;② 时间间隔 的计算容易因为某些信号存在多峰|RES|而出现误差;③ TFR计算复杂。相关研究中S2宽分裂检测的缺点总结如下:
1) 使用时频表示来确定A2和P2非常复杂,特别是对于非单位S2和持续时间长的心声。
2) 使用 来判断S2分裂易受心跳影响;例如,正常S2在低心跳时 可能大于高心跳时S2宽分裂的 [9] [10] 。
3) 由于时间间隔接近 [3] ,在吸气阶段仅使用 从固定分裂中区别宽分裂较复杂。然而在呼气阶段,宽分裂和固定分裂区别明显。相比之下,宽分裂和生理性分裂只在吸气阶段时间间隔有所不同。
4) 在未指定给定心音来自吸气或呼气算法阶段的情况下判断S2分裂尤为困难,因为S2宽分裂易受呼吸活动的调节 [9] [11] [12] [13] [14] 。
5) 在一个周期心音内仅使用时间间隔 会降低检测精度,因为即使在相同的吸气或呼气阶段,S2的时间间隔 也会有所差异 [15] 。
鉴于此,为了实现A2和P2的快速测定和定位,本研究提出了一种基于高斯混合模型的简单高效的新方法来拟合A2和P2从而判断A2和P2的状态。同时为了解决使用时间间隔 判断S2分裂时分裂程度受心跳的影响,我们提出了一种基于高斯混合模型的S2分裂系数( )来评估S2分裂程度的新方法。而为了避免因缺乏考虑整个呼吸阶段而将S2的宽分裂误认为吸气期的固定分裂或者呼气期间的生理性分裂,本研究在分析中考虑到几个完整的呼吸阶段的 。为了避免从呼气阶段或吸气阶段得出基于周期S2的 的片面结论,我们使用 均值( )和 标准差( )来区分宽分裂和生理性分裂以及固定分裂。此外 均值的统计量 可在某些情况下用于区分宽分裂和第三心音(S3)。此外,本研究对在线心音数据库和医院临床心音数据集中S2宽分裂音、S2固定分裂音、附加音S3进行评估。
2. 方法
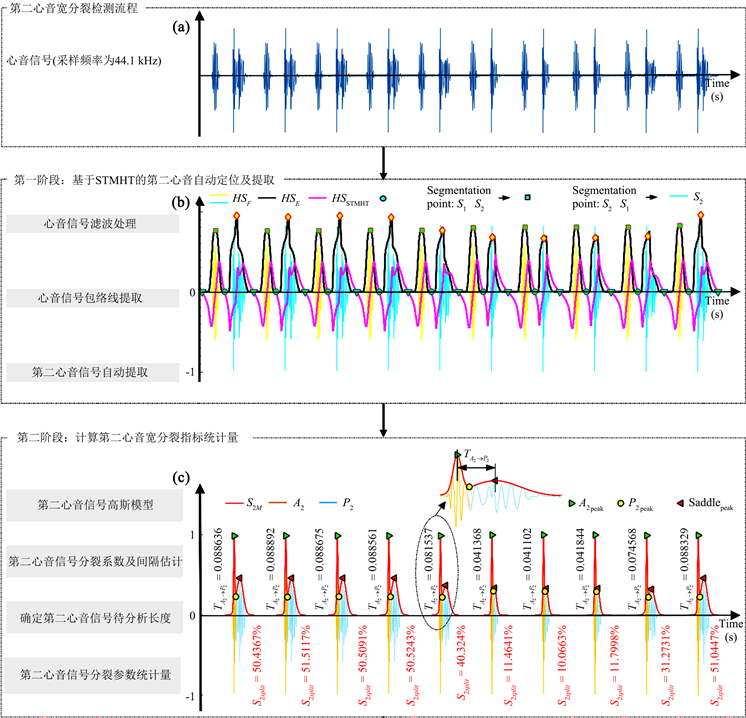
Figure 1. The intelligent system overview of the proposed methodology for detecting wide splitting of S2
图1. 诊断第二心音宽分裂的智能系统概论
本文提出的新型自动检测系统如图1所示。该系统由S2自动提取程序、S2分裂系数和时间间隔 提取程序和S2宽分裂检测程序两个阶段组成。第一阶段,基于小波分解方法生成给定心音(HS)的过滤音(HSF)的包络HSE,基于短时修正希尔伯特变换(STMHT)对S1和S2的分割点以及S1和S2的峰值进行自动定位,然后根据一个心音周期内舒张时间间隔和收缩期时间间隔的关系自动提取S2。在第二阶段,首先提出了S2区间内基于高斯混合模型的包络HSE回归模型,以定位A2和P2的位置,并自动定位A2和P2之间的鞍点( )。然后计算分裂系数 和时间间隔 。
2.1. 第1阶段:S2自动提取
2.1.1. 心音采集和预处理
原始心音(HS)由3MTM Littmann MODEL 3200电子听诊器记录,在FS = 44.1 kHz时采样,并由16位A/D转换器数字化。对采集到的HS进行预处理,通常包括过滤呼吸音、功率干扰、肺音、环境噪声 [16] 等不需要的成分,因为小波分解使用不同的窗口大小在时域和频域都提供了很好的分辨率,所以使用小波分解(WD)对HS进行预处理并表示为HSF,其中宽窗口适用于低频成分,窄窗口适用于HS的高度复杂非平稳性质 [17] [18] [19] [20] [21] 。给定HS的小波分解 [22] 可以用一组尺度函数 和小波函数来描述:
(1)
其中第一个成分是HS的粗近似,第二个成分给出了HS的细节分辨率函数。公式(1)第n个尺度的膨胀系数可以根据 的膨胀系数计算:
(2)
其中 和 表示将HS分解为低频和高频成分的低通和高通滤波器的脉冲响应。之后,用下采样重新采样两个给定的成分信号。HS的多分辨率分解过程描述于图2。并以最大信噪比和最小均方根误差为标准,将Daubechies小波(Db10)为母小波,与Daubechies小波(Db2~Db10),Haar小波,Symlets小波(Sym2~Sym6),Coiflet小波(Coif1~Coif5)和BiorSplines小波(Bior1.1~Bior3.3)进行比较 [18] 。

Figure 2. Illustration of the S2 location and extraction principe. (a) shows the typical example of a heart sound with a single S2; (b) shows the typical example of heart sound signal with typical wide splitting of S2
图2. S2定位和提取。图(a),(b)分别描绘S2典型生理性分裂和S2典型宽分裂
在本研究中,我们通过MATLAB软件对一个给定的HS进行小波分解wavedec和小波重建waverec处理。基于采样频率Fs = 44.1 kHz,HS的有效频率范围在 [23] 中描述,采用10级近似系数去除21.5 Hz以下的低频成分,并采用5级细节系数(689~1378 Hz)用于去除689 Hz以上的高频成分。因此,预处理后的信号(HSF)频带限制为21.5~689 Hz的成分,由6级至10级的细节系数的成分重建。此外,HSF被规范为:
(3)
2.1.2. HSE包络提取
为了定位S1和S2之间的分割点与几何中心峰,将使用短时二阶中心矩提取的 包络线表示为 ,因为与其它有效包络相比,它在克服意外噪声和振幅变化方面具有卓越的性能 [23] 。使用该方法生成 包络 描述如下:
对于给定的预处理心音 的n个时间点: 在时间为n的WN邻域内, 通过以下方式获得:
(4)
当 时根据 [23] 的报道结合 [24] 描述的S1或S2的持续时间,设定 。最后, 由公式5标准化,并在图1(b)中用黑线绘制。
(5)
研究 [24] 提出的基于包络 的 短时自修正希尔伯特变换(STMHT)曲线,已被证明能有效地将心音自动分割为S1成分和S2成分 [23] 。以下是对此方法的描述:
对于N点心音包络 ( )和移动窗口 若长度为奇数M,则 , 曲线为品红色的线(图1(b))且:
(6)
当 并且
(7)
根据研究 [25] ,结合2.1.1节描述的采样频率Fs,选取M = 44101作为移动窗口WM的大小。
2.1.3. S2自动提取
通过插图表征:靠近S2的峰值(记为 ),靠近S1的峰值(记为
 ),从S1到S2的分割点(记为
 )和从S2到S1的分割点(记为
 )。原理如图2所示,描述如下:
1) 的几何中心峰值点能通过 的负向正极(N2P)点自动定位(图2(a)和图2(b))。
2) 分割点可通过正向负极(P2N)点确定(图2(a)和图2(b))。
因此,S2和S1的时间指数可以通过 的NPPs来确定,而 的PNPs可以用来定位S1和S2之间的分割点。周期性心音舒张时间间隔大于收缩期时间间隔。因此,可以使用算法1在典型的S2生理性分裂信号和S2宽分裂信号中自动定位S2的第n个值(记为S2n)和S2n的包络线( )。作为从S2生理性分裂和宽分裂的心音信号中自动提取S2和 的一个例子,图2(a)解释了对典型的S2生理性分裂的第n周期心音的S2提取,图2(b)显示了典型S2宽分裂的第n周期心音的S2提取的n个值。
2.2. 第2阶段:S2split定义
2.2.1. S2M提取
从图3(b1)所绘的典型S2固定分裂示例和图3(c1)所绘的吸气阶段典型S2宽分裂的图发现:每一个S2中A2与P2都明显存在,特别是图3(b2)和图3(c2)中描绘的S2绝对值。此外,这两个成分呈现正态分布的特征。图3(a1)绘制了S2,图3(a2)中心音的绝对值显然趋于正态分布,图3(d2)将的S3和S2作为整个S2的两个组成部分从典型心音中提取出来,并在图3(d1)中绘制出S3,由于两个成分之间的距离大于图3(c)中S2的宽分裂的距离和图3(b)中S2固定分裂的距离。因此,这两个成分被提出用来辅助高斯混合模型估计成分A2和P2的组成,然后以估计参数为判断S2宽分裂的标准依据。在统计学中GMM使用高斯成分k与参数线性混合( , )对给定的曲线建模,例如研究 [16] 。在这项研究中,把从HS中自动提取的一系列的S2序列在图1(a)和图1(b)中绘制,基于估计参数( )的高斯成分k和在S2x轴对应的t,S2M可以用高斯成分的和来拟合:
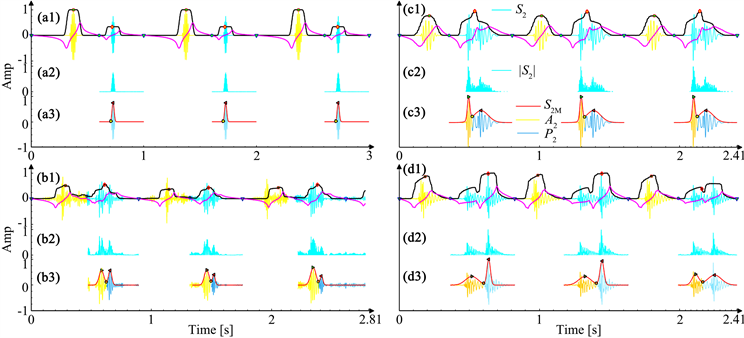
Figure 3. The classic examples of heart sound with the common types of S2 split. (a) represents the S2 with no split; (b) represents the S2 with fixed split; (c) represents the S2 with wide split; (d) shows S2 with extra sound S3
图3. 典型心音示例与S2分裂。(a) 表示没有分裂的S2;(b) 表示分裂固定的S2;(c) 表示S2宽分裂;(d) 为含S3的S2
(8)
并且S2M须满足:
(9)
其中每个S2内的A2和P2的K设为2,N是S2的长度,并且 ( )是以 为中心曲线表征的第k个成分,其中 是峰值的高度, 控制其宽度。在峰值的两侧,曲线的末端迅速下降并趋近x轴。为了评估拟合度,给出R的平方值R2,其公式如下:
(10)
其中残差平方和( )与总平方和( )被用来评估S2M拟合给定|S2|的性能。其取值范围为 并且越接近1表示拟合效果越好。这项研究围绕S2进行,其中包括10名患者的656个S2宽分裂周期、16名患者的1433个S2生理性分裂周期、13名患者的586个S2固定分裂周期和4名患者的233个S3周期都在3.1小节中描述。此外得到R2的统计量 。根据Julian J. Faraway [26] 的结论,当 时,使用GMM拟合给定的生物医学信号是有效的,因为变量的相关性往往更弱,并且在生物科学中存在相当大的噪声。因此验证了用GMM拟合给定心音的可行性。S2M所对应的模型为:S2的未分裂图在图3(a2)表示,S2的固定分裂在图3(b2)表示,S2的宽分裂在图3(c2)表示并且S2和S3分别在图3(a3),图3(b3),图3(c3),图3(d3)绘制,表明了:
1) 因为两个估计值之一 近似于零,所以对于图3(a2)中没有S2分裂的S2M似乎是一个成分(见图3(a3))。也就是一个总成分涵盖了另一个成分,重叠率约为100%。
2) 对于图3(d2)中具有S3的S2来说,S2M两个估计成分之间的重叠度似乎比图3(b3)和图3(c3)中所示的重叠程度更小。此外,绘制在图3(b3)和图3(c3)中的S2M的两个估计成分之间的间隔似乎比其它的图大。因此,两者之间的重叠度和间隔估计成分可以用来区分S2分裂中的S3和未分裂的S2。
3) 图3(b2)中绘制的固定分裂中S2M的两个估计成分之间的重叠率与图3(c2)中绘制的S2宽分裂相似。所以两个估计成分之间的间隔也是如此。然而,区分这两个成分来自于图3(a2)中无分裂的S2还是来自图3(d2)中绘制的具有S3的S2比较容易。
4) 重叠率和两个估计量的距离都可以用来评估分裂程度:① 重叠度越小,分裂程度就越大;② 分裂程度越大,两个成分的间隔就越大。
因此,使用由重叠率和间距去评估两个成分之间分裂程度的系统被提议用来评估S2宽分裂的程度并在下一节中概述。
2.2.2. S2split定义
在评估具有两个成分的高斯混合模型的可分离性的大多数现有衡量指标中,巴氏距离 [27] 中提出了重叠率(OLR),它使用它们的概率密度函数来量化两个混合成分的分离 [28] 。由于OLR不仅提供了“可视化”的解释,而且提出了对混合成分的可分离性的更好的解释 [29] ,所以OLR衡量方式已成功地应用于研究中 [30] [31] 。OLR由鞍点概率密度函数(PDF)值与最低局部最大值处概率密度函数值的比值获得:
(11)
其中 是鞍点( )处的PDF值, 是在局部的最低最大值点( )的PDF值。OLR用两个成分组成的S2M (红色)进行图解说明:图4中A2 (用黄色标注)和P2 (用蓝色标注),表征了它随两个成分的距离的增加而减小(表示为 ),文献 [29] 中的定性总结如下:① 若 ,这两个混合成分会因为无法在它们之间找到鞍点而完全重叠;② 若 ,重叠程度较高;③ 时部分重叠;④ 若 略有重叠;⑤ 若 ,其无重叠。实际上, 可以用于量化两个混合成分的分离程度。为了评估模型S2M中两个混合成分(A2和P2)的分裂程度(即可分离性),提出了S2分裂系数( )并定义为:
(12)
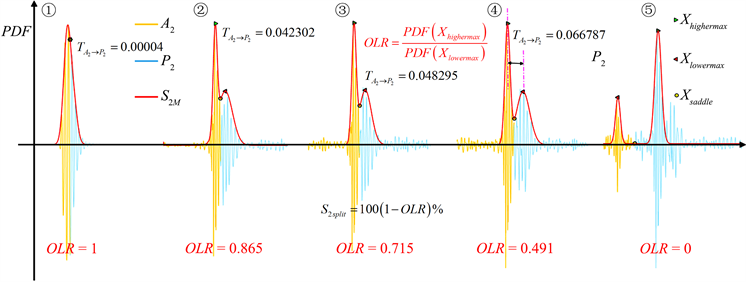
Figure 4. Two components A2 and P2 that are completely overlapping (no splitting), strongly overlapping (slightly splitting), partially overlapping (partially splitting), slightly overlapping (strongly splitting), and no overlapping (completely-splitting) in the estimated S2M
图4. 两个成分(A2和P2)在估计S2M中完全重叠(不分裂)、强重叠(轻微分裂)、部分重叠(部分分裂)、轻微重叠(强烈分裂)和不重叠(完全分裂)
因此, 的值越大,S2的分裂程度越严重。即 时表明S2M中不存在分裂,两个混合成分(A2和P2)完全重叠, 时两个混合成分之间的距离很大,表示混合物成分完全分裂。但是,在没有S2分裂但有S3的情况下,S2和S3的距离较远导致 从而使现有的S3会被误判为S2的总分裂。因此,除参数 外,为避免S3将两个混合成分的时间间隔误判为P2,如图3所示,公式为:
(13)
其中 为高斯成分k ( )的估计参数 ,并且 是一定的。由于时间间隔 在吸气时变宽,在呼气时变窄 [3] ,导致了吸气期间和呼气期间的 明显不同,所以要首先确定分析心音持续时间(包括几个合适的呼吸周期)。
3. 性能评估
利用A2和P2之间的时间间隔 来判断第二心音S2的宽分裂程度存在一定的不足。 极易受到心跳影响且在不考虑呼吸阶段的情况下很难区分其它类型S2分裂和额外S3。
根据混淆矩阵中的真阳(TP)、假阴(FN)、真阴(TN)和假阳(FP)测量灵敏度(Se)、特异性(SP)、总体准确性(OA)、F1评分和科恩的卡帕系数(k)来评估本研究的性能:
1) Se
灵敏度衡量正确识别的阳性比例,使用以下公式计算:
(14)
2) Sp
特异性需要正确识别阴性的比例来衡量,公式如下:
(15)
3) OA
综合准确率评价分类算法定义为:
(16)
4) F1 score
F1评分是衡量准确性的标准,它使用了测试的精度和灵敏度来计算评分 [31] ,由公式给出:
(17)
5) 科恩的卡帕系数(k)
科恩的卡帕系数对同一现象的两名评级者的一致或不一致程度进行衡量 [32] 。科恩的卡帕系数由混淆矩阵计算 [33] :
(18)
其中
(19)
本文通过与A2和P2的区间值进行比较该方法,包括研究 [34] 提出的通过S变换的
,研究 [35] 中使用呼吸调节分裂测量的
,
采用希尔伯特振动分解和重新分配平滑伪维格纳维尔分布的研究 [8] ,
采用重新分配平滑伪维格纳维尔分布的研究 [36] ,
采用平滑伪维格纳维尔分布的研究 [3] ,
采用小波变换的研究 [3] 。此外,研究 [3] 指出,与小于30 ms的正常分裂相比,S2的宽分裂持续时间约为50 ms。因此,结合研究 [3] 的结论与研究 [8] [34] [36] 检测S2异常分裂持续时间,将其与持续时间
ms进行性能评价,其中
设为2~30,步长为2。图5的实验结果表明:① 当
时,由于
,因此S2的宽分裂都被误判为其他分裂,而其他分裂大部分都被正确预测,因为得到的Sps,大于
对应的0.8571,这使得由图5中 标记的
,而导致一致性较差;② 当
增加时,Se的增加k由负变为正,但k在
时减小(具体结果见表1)。预测结果对应的持续时间为
(
) ms,如表1所示,仅使用时间间隔不可能辨别S2的分裂,因为一致性较高,对应最大值的
,而本研究提出方法性能指标都为1。
标记的
,而导致一致性较差;② 当
增加时,Se的增加k由负变为正,但k在
时减小(具体结果见表1)。预测结果对应的持续时间为
(
) ms,如表1所示,仅使用时间间隔不可能辨别S2的分裂,因为一致性较高,对应最大值的
,而本研究提出方法性能指标都为1。
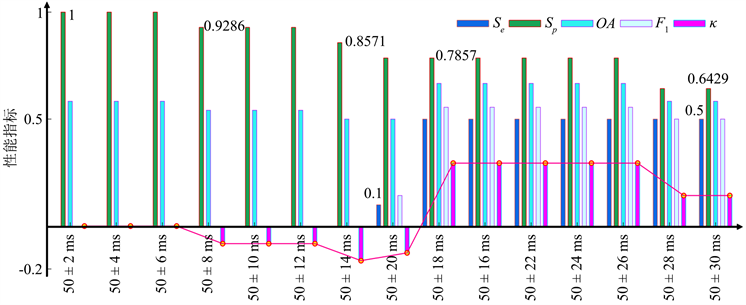
Figure 5. Experimental results achieved by setting the different threshold values where δT is setting from 2 to 30
图5. 通过设置不同的阈值获得的实验结果,其中δT设置为2到30
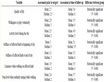
Table 1. Comparative analysis results
表1. 可比较的分析结果
4. 结论
人体中主动脉瓣关闭(A2)到肺动脉瓣关闭(P2)的时间间隔( )存在个体差异,易受心率影响,且在第三心音中很难与之区分,若仅使用 并不能精确地评价第二心音的分裂状况,本文给出分裂系数( )定义与求解方法,采用 与 相结合的评价方式运用到第二心音分裂的判断中。将两参数结合的方法应用于多个临床数据集中,对43位患者共2908个心音周期进行性能评估,在总体精度为1的情况下可得出结论为: ,且 为异常分裂; ,且 为正常分裂; 为单一无分裂第二心音,未来研究和发展方向为如何划分更为具体分裂类型指标:如第二心音宽分类、固定分裂、逆分裂等。
基金项目
湖南省教育厅的省自然科学基金面上项目(2022JJ30282);湖南省教育厅的教育厅重点项目(21A0403);东莞市振海电子科技有限公司横向项目(JSHT-L-2022-024);东莞市振海电子科技有限公司科技成果转化项目(JSHT-L-2022-026)。
文章引用
刘 超,刘熠辉,何 勇,刘 智,张宇欣,何杵壕,曾文华,贺家俊. 基于高斯拟合的第二心音分裂评价方法
Anovel Evaluation Method of S2 Split Based on Gaussian Fitting[J]. 医学诊断, 2023, 13(02): 205-217. https://doi.org/10.12677/MD.2023.132035
参考文献
- 1. Boutana, D., Djeddi, M. and Benidir, M. (2007) Identification of Aortic Stenosis and Mitral Regurgitation by Heart Sound Segmenta-tion on Time-Frequency Domain. Proceedings of 2007 5th International Symposium on Image and Signal Processing and Analysis, Istanbul, 27-29 September 2007, 1-6. https://doi.org/10.1109/ISPA.2007.4383654
- 2. Coviello, J.S. (2015) Auscultation Skills: Breath & Heart Sounds. LWW, Philadelphia.
- 3. Debbal, S.M. and Bereksi-Reguig, F. (2007) Automatic Measure of the Split in the Second Cardiac Sound by Using the Wavelet Transform Technique. Computers in Biology and Medicine, 37, 269-276. https://doi.org/10.1016/j.compbiomed.2006.01.005
- 4. Yildirim, I. and Ansari, R. (2007) A Robust Method to Estimate Time Split in Second Heart Sound Using Instantaneous Frequency Analysis. Proceedings of 2007 29th Annual International Conference of the IEEE Engineering in Medicine and Biology Society, Lyon, 22-26 August 2007, 1855-1858. https://doi.org/10.1109/IEMBS.2007.4352676
- 5. Benedetto, J.J., Mcclellan, J. and Cochran, D. (2005) Time-Frequency and TimeScale Methods. Birkhäuser, Boston.
- 6. Rhif, M., Ben Abbes, A., Farah, I.R., et al. (2019) Wavelet Transform Application for/in Non-Stationary Time-Series Analysis: A Review. Applied Sciences, 9, Article 1345. https://doi.org/10.3390/app9071345
- 7. Tang, H., Park, Y. and Ruan, C. (2015) Nonlinear Time Domain Relation between Res-piratory Phase and Timing of the First Heart Sound. Computational and Mathematical Methods in Medicine, 2015, Article ID: 410102. https://doi.org/10.1155/2015/410102
- 8. Barma, S., Chen, B.W., Ji, W., et al. (2015) Measurement of Duration, Energy of In-stantaneous Frequencies, and Splits of Subcomponents of the Second Heart Sound. IEEE Transactions on Instrumentation and Meas-urement, 64, 1958-1967. https://doi.org/10.1109/TIM.2014.2383071
- 9. Reed, T.R., Reed, N.E. and Fritzson, P. (2004) Heart Sound Analysis for Symptom Detection and Computer-Aided Diagnosis. Simulation Modelling Practice and Theory, 12, 129-146. https://doi.org/10.1016/j.simpat.2003.11.005
- 10. Cherif, L.H. and Debbal, S.M. (2018) The Impact of Valvular Pathologies on Heart Rate, the Second Heart Sound Split, and Systolic Pulmonary Arterial Pressure. Journal of Mechanics in Medicine and Biology, 18, Article ID: 1850008. https://doi.org/10.1142/S0219519418500082
- 11. Luisada, A.A. (1971) The Second Heart Sound in Normal and Abnormal Con-ditions. The American Journal of Cardiology, 28, 150-161. https://doi.org/10.1016/0002-9149(71)90363-8
- 12. Tang, H., Chen, H. and Li, T. (2017) Quantitative Measurement of Respiratory Split in the Second Heart Sound. Computing in Cardiology, 44, 1-4. https://doi.org/10.22489/CinC.2017.305-067
- 13. Tang, H., Gao, J., Ruan, C., et al. (2013) Modeling of Heart Sound Morphol-ogy and Analysis of the Morphological Variations Induced by Respiration. Computers in Biology and Medicine, 43, 1637-1644. https://doi.org/10.1016/j.compbiomed.2013.08.005
- 14. Will, C., Shi, K., Schellenberger, S., et al. (2018) Radar-Based Heart Sound Detection. Scientific Reports, 8, Article No. 11551. https://doi.org/10.1038/s41598-018-29984-5
- 15. de Lima Hedayioglu, F. (2014) Looking at the Second Heart Sound: A Multi-Facet Study. Universidade do Porto, Porto. (In Portugal)
- 16. Zheng, Y., Guo, X., Jiang, H. and Zhou, B. (2017) An Innovative Multi-Level Singular Value Decomposition and Compressed Sensing Based Frame-work for Noise Removal from Heart Sounds. Biomedical Signal Processing and Control, 38, 34-43. https://doi.org/10.1016/j.bspc.2017.04.005
- 17. Sun, S., Wang, H., Cheng, C., et al. (2017) PCA-Based Heart Sound Feature Generation for a Ventricular Septal Defect Discrimination. Proceedings of 2017 14th International Computer Conference on Wavelet Active Media Technology and Information Processing (ICCWAMTIP), Chengdu, 15-17 December 2017, 128-133. https://doi.org/10.1109/ICCWAMTIP.2017.8301464
- 18. Ali, M.N., El-Dahshan, E.S.A. and Yahia, A.H. (2017) Denoising of Heart Sound Signals Using Discrete Wavelet Transform. Circuits, Systems and Signal Processing, 36, 4482-4497. https://doi.org/10.1007/s00034-017-0524-7
- 19. Chen, Y., Luo, Y., Huang, W., et al. (2017) Machine-Learning-Based Classifi-cation of Real-Time Tissue Elastography for Hepatic Fibrosis in Patients with Chronic Hepatitis B. Computers in Biology and Medicine, 89, 18-23. https://doi.org/10.1016/j.compbiomed.2017.07.012
- 20. Hamidi, M., Ghassemian, H. and Imani, M. (2018) Classification of Heart Sound Signal Using Curve Fitting and Fractal Dimension. Biomedical Signal Processing and Control, 39, 351-359. https://doi.org/10.1016/j.bspc.2017.08.002
- 21. Sun, S., Wang, H., Chang, Z., et al. (2018) On the Mahalanobis Distance Classi-fication Criterion for a Ventricular Septal Defect Diagnosis System. IEEE Sensors Journal, 19, 2665-2674. https://doi.org/10.1109/JSEN.2018.2882582
- 22. Sweldens, W.W. (1996) Wavelets: What Next? Proceedings of the IEEE, 84, 680-685. https://doi.org/10.1109/5.488707
- 23. Sun, S. (2015) An Innovative Intelligent System Based on Automatic Diagnostic Feature Extraction for Diagnosing Heart Diseases. Knowledge-Based Systems, 75, 224-238. https://doi.org/10.1016/j.knosys.2014.12.001
- 24. Varghees, V.N. and Ramachandran, K.I. (2014) A Novel Heart Sound Activity Detection Framework for Automated Heart Sound Analysis. Biomedical Signal Processing and Control, 13, 174-188. https://doi.org/10.1016/j.bspc.2014.05.002
- 25. Sun, S., Wang, H., Jiang, Z., et al. (2014) Segmentation-Based Heart Sound Feature Extraction Combined with Classifier Models for a VSD Diagnosis System. Expert Systems with Applications, 41, 1769-1780. https://doi.org/10.1016/j.eswa.2013.08.076
- 26. Pole, A., West, M. and Harrison, J. (2005) Time Series: Modeling, Computation and Inference (Chapman & Hall/CRC Texts in Statistical Science). Chapman and Hall/CRC, London.
- 27. Leblanc-Hotte, A., Chabot-Roy, G., Odagiu, L., et al. (2018) High-Throughput Refractive Index-Based Microphotonic Sensor for Enhanced Cellular Dis-crimination. Sensors and Actuators B: Chemical, 266, 255-262. https://doi.org/10.1016/j.snb.2018.03.087
- 28. Prodigious (2018) Abnormally Wide Split Second Sound—Heart Sounds Collec-tion. https://www.youtube.com/watch?v=D5SYn26JsFI
- 29. Sun, H. and Wang, S. (2011) Measuring the Component Overlapping in the Gaussian Mixture Model. Data Mining and Knowledge Discovery, 23, 479-502. https://doi.org/10.1007/s10618-011-0212-3
- 30. Yan, J., Zhang, Z., Wang, W., et al. (2019) A Hybrid Data and Model Transfer Framework for Distributed Machine Learning. Proceedings of 2019 11th International Conference on Wireless Communications and Signal Processing (WCSP), Xi’an, 23-25 October 2019, 1-7. https://doi.org/10.1109/WCSP.2019.8928046
- 31. Sokolova, M., Japkowicz, N. and Szpakowicz, S. (2006) Beyond Accuracy, F-Score and ROC: A Family of Discriminant Measures for Performance Evaluation. In: Sattar, A. and Kang, B., Eds., AI 2006: AI 2006: Advances in Artificial Intelligence, Lecture Notes in Computer Science, Vol. 4304, Springer, Berlin, 1015-1021. https://doi.org/10.1007/11941439_114
- 32. Cohen, J. (1960) A Coefficient of Agreement for Nominal Scales. Educational and Psychological Measurement, 20, 37-46. https://doi.org/10.1177/001316446002000104
- 33. Phung, V.H. and Rhee, E.J. (2019) A High-Accuracy Model Average Ensemble of Convolutional Neural Networks for Classification of Cloud Image Patches on Small Datasets. Applied Sciences, 9, Article No. 4500. https://doi.org/10.3390/app9214500
- 34. Luo, H., Westphal, P., Shahmohammadi, M., Heckman, L.I., Kuiper, M., Cornelussen, R.N., Delhaas, T. and Prinzen, F.W. (2021) Second Heart Sound Splitting as an Indicator of Interventricular Mechanical Dyssynchrony Using a Novel Splitting Detection Algorithm, Physiological Reports, 9, e14687. https://doi.org/10.14814/phy2.14687
- 35. Tang, H., Chen, H. and Li, T. (2017) Discrimination of Aortic and Pulmonary Components from the Second Heart Sound Using Respiratory Modulation and Measurement of Respiratory Split. Applied Sciences, 7, Article No. 690. https://doi.org/10.3390/app7070690
- 36. Djebbari, A. and Bereksi-Reguig, F. (2013) Detection of the Valvular Split within the Second Heart Sound Using the Reassigned Smoothed Pseudo Wigner-Ville Distribution. Biomedical Engineering Online, 12, Article No. 37. https://doi.org/10.1186/1475-925X-12-37