Advances in Geosciences
Vol.2 No.1(2012), Article ID:521,15 pages DOI:10.4236/ag.2012.21001
Distribution of Seismic Damaged Buildings along the Trace of Ground Surface Rupture Caused by the Ms 8.0 Wenchuan Earthquake*
1Institute of Engineering Mechanics, China Earthquake Administration, Harbin
2Foshan Seismological Bureau, Foshan
Email: jisheng_zhao@163.com
Received: Oct. 9th, 2011; revised: Oct. 28th, 2011; accepted: Nov. 17th, 2011
ABSTRACT:
Field investigations of the Ms 8.0 Wenchuan Earthquake show that buildings on the ground surface rupture zone were severely damaged. The surface rupture zone consists of three parts. Two of the parts are respectively along the trace of the Beichuan-Yingxiu fault and the Guanxian-Jiangyou fault. The former part is about 260 km long, which starts at Yingxiu and terminates at Nanba; the latter part is about 50 km long which starts at Tongji and terminates at Jushui. The third part connects the Beichuan-Yingxiu fault and the Guanxian-Jiangyou fault from Xiao Yudong, to Tongji, which is about 6 km long. The maximum vertical and horizontal offset of 4.8 m and 4.7 m, respectively, were observed along the Beichuan-Yingxiu fault, whereas a maximum vertical offset of 3.5 m occurred along the GuanxianJiangyou fault. The distribution of damaged buildings along the trace of ground surface was investigated in many segments. The seismic damage distribution in Nanba area will be introduced considering that lots of rural residents live there. Vertical and horizontal offset of 0.5 - 2.5 m and 1.3 - 2.7 m, respectively, were observed along this segment, and the significant width of deformation caused by the offset is 7.6 - 18 m. In this segment, the building of intact ratio is zero, the ratio of medium to the serious damage is 0.576 and the collapse ratio is 0.424 within 50 m. Totally 1699 structures were investigated in 15 segments along the ground surface rupture zone. The collapse ratio decreases from 0.33193 to 0.29264 corresponding to the fault distance 0 to 150 m. Here the fault distance is defined as a distance from location of structure to the trace line of rupture points; the building of intact ratio increases from 0.08824 to 0.12480 corresponding to the fault distance 0 to 250 m. In other way, earthquake damage index of building structure decreases from 0.72 to 0.47344 corresponding to the fault distance 0 to 150 m. There is no significant regularity beyond 150 m.
Keywords: Wenchuan Earthquake; Surface Rupture; Distribution of Damaged Buildings
汶川8.0级地震地表破裂迹线附近建筑物的震害分布*
赵纪生1,吴景发2,师黎静1,刘艳琼1
1中国地震局工程力学研究所,哈尔滨
2佛山市地震局,佛山
Email: jisheng_zhao@163.com
摘 要:
汶川地震地表破裂带主要分三部分,映秀–北川地表破裂带、通济–雎水地表破裂带、以及小鱼洞地表破裂带。映秀–北川地表破裂带是汶川地震的主要破裂带,处于龙门山中央断裂带上,全长达260 km以上;通济–雎水地表破裂带是汶川地震在前山断裂带上产生的地表破裂,全长约50 km;小鱼洞破裂带,是主断裂带上的一个分支,从小鱼洞经草坝,延伸至向峨,破裂带由北西向逐渐过渡到南西向,全长约6 km。已发现的最大同震位错位于主破裂带的都江堰虹口附近,最大垂直位错4.8 m、最大水平右旋位错4.7 m。本文以南坝镇地震地表破裂点附近的建(构)筑物震害调查为例展开,此段地表垂直位错0.5~2.5 m,水平位错1.3~2.0 m,地表强变形带宽度7.6~18 m;相应地,50 m范围内的房屋完好率为0,倒塌率为0.424,中等破坏与严重破坏率为0.576。沿地表破裂带上的15个乡镇的1699栋建(构)筑物震害表明,在距地表破裂迹线距离为150 m范围内的建筑物的倒塌率逐渐下降,即从0.33193降低到0.29264;在距地表破裂迹线距离为250 m范围内的建筑物的完好率逐渐上升,即从0.08824上升到0.1248;超过这样的区域,倒塌率和完好率趋于平缓。从震害指数角度,可以发现,在距地表破裂迹线距离为150 m范围内的建筑物的震害指数逐渐下降,即从0.72降低到0.47344;超过这样的区域,震害指数规律性不明。
收稿日期:2011年10月9日;修回日期:2011年10月28日;录用日期:2011年11月17日
关键词:汶川地震;地表破裂;建筑物震害
1. 引言
汶川地震的地表主破裂带沿龙门山断裂带的中央断裂(北川–映秀断裂、茶坝–林庵寺断裂最南段)以及青川断裂与茶坝–林庵寺断裂之间的一条NE向断裂展布,南西起自汶川县的映秀与三江之间,向北东经都江堰市的虹口、向俄、彭州市的小渔洞、龙门山镇、北川的擂鼓、曲山(北川县城)、陈家坝、桂溪、平武的平通、南坝、石坎子等地,并可能再向北东抵达青川附近,连续总长度达260公里以上。同时,还发现和查明这次大地震发生时,沿龙门山断裂带前山断裂(江油–灌县断裂)的一段也发生了地表破裂,展布于彭州的通济以东至安县的睢水,途经彭州的白鹿、什邡的八角、绵竹的红白、德阳的汉旺等地,全长约50公里[1-5]。
地表破裂带的运动学特征反映出发震断层的同震运动方式为右旋–逆断层作用,断层的北西盘相向北东东方向运动,同时上冲。沿地表主破裂带,多数地段的同震垂直位错和水平位错量在2~4 m之间,垂直与水平位错量的比例大体为1:1;已发现的最大同震位错位于主破裂带的都江堰虹口附近,最大垂直位错4.8 m、最大水平右旋位错4.7 m。沿地表破裂带通常表现为斜冲断坎,并在通过河床时形成小型跌水坎。沿前山断裂(江油–灌县断裂)产生的次级地表破裂带中,多数地段的同震垂直和水平位错量在0.5~2 m之间,垂直位错略大于水平位错,且其破裂面的倾角较主破裂带缓。另外,由于逆冲运动分量显著,地震地表破裂在许多地段表现为拱曲坎,尤其在地表松软土层的情况下,拱曲坎上较少出现新鲜的破裂面。
沿地表破裂带或形变带是建筑物震害及次生灾害最严重的地带,位于其上的建筑物不可能抵御显著和大幅度的同震位错或变形[5]。本文参考汶川8.0级地震地表破裂考察[1]的基本成果,详细考察了地震破裂带上的15个破裂点周围的1699栋建筑物、构筑物进行了震害评估,破裂点的地名有小鱼洞、高原、深溪沟、草坝、汉旺镇、岳家山、蓥华镇、金花镇、八角镇、白鹿镇、擂鼓镇、桂溪乡、南坝、建康、平通,由于破裂点处居民分布不均,每个破裂点处评估震害的房屋数量也不同。应用调查数据,初步分析了发震断层引起的地表破裂与震害的关系。
2. 典型破裂处及其周围建筑物的震害调查
2008年8月3日~27日我们沿地震破裂带上的15个破裂点周围的1699栋建筑物、构筑物进行了震害评估[2]。由于破裂点处居民分布不均,每个破裂点处评估震害的房屋数量也不同。鉴于每一破裂点上调查的建筑物较多,图片更多。限于篇幅,下面仅列举南坝镇的破坏情况,给出建筑物的倒塌率/完好率沿断层距的关系。
2.1. 地表破裂点
南坝镇的建康村、何家坝、文家坝、古龙村等地可见多处地表破裂痕迹[6],具体位置见图1和表1。其中,南坝石坎加油站外公路被错断,竖向位错超过2 m,逆冲右旋性质,走向40˚;地表破裂通过古龙村后,错过了村旁小山包继续沿走向延伸,逆冲右旋性质,水平最大位错达2.0 m,见照片(1~6)。

Figure 1. Curve: system result of standard experiment distribution of surface rupture site around Nanba town
图1. 南坝镇区域内地表破裂点分布图

Photo 1. NB-1 thrust dextral, vertical dislocation 2.5 m, located at Jiankang of Nanba Town, Mirror to N50˚W
照片1. 南坝-1逆冲右旋,竖向位错2.5 m,位于南坝镇建康村,镜向N50˚W

Photo 2. NB-2 thrust dextral, vertical dislocation 2.1 m, located at a hill near Shika gas station, Mirror to N20˚W
照片2. 南坝-2逆冲右旋,竖向位错2.1 m,位于石坎加油站后山,镜向N20˚W

Photo 3. NB-3 dextral strike-slip, strike-slip 2 m, located at Wenjiaba of Nanba Town, Mirror to N80˚W
照片3. 南坝-3 右旋走滑,走滑量为2 m,位于南坝文家坝村,镜向N80˚W

Photo 4. NB-4 apparent uplift in field, vertical dislocation 0.5 m, located at Mowan village, Mirror to N40˚E
照片4. 南坝-4庄稼地明显抬升,竖向位错0.5 m,位于磨湾村,镜向N40˚E
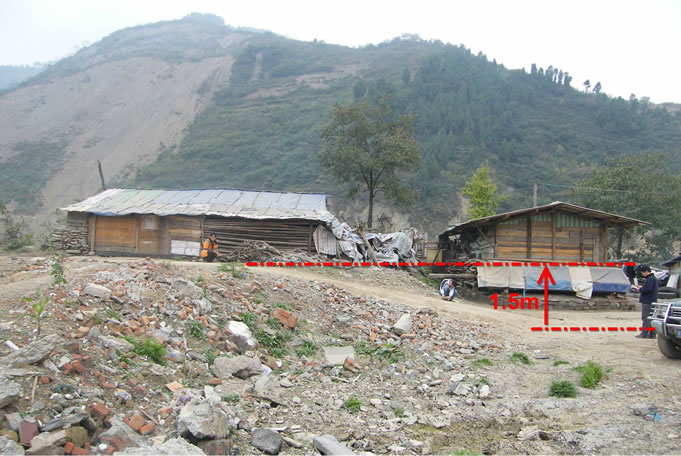
Photo 5. NB-5 thrust dextral, vertical dislocation 1.5 m, horizontal dislocation 1.3 m, Mirror to the North
照片5. 南坝-5逆冲右旋,竖向位错1.5 m,水平位错1.3 m,镜向北
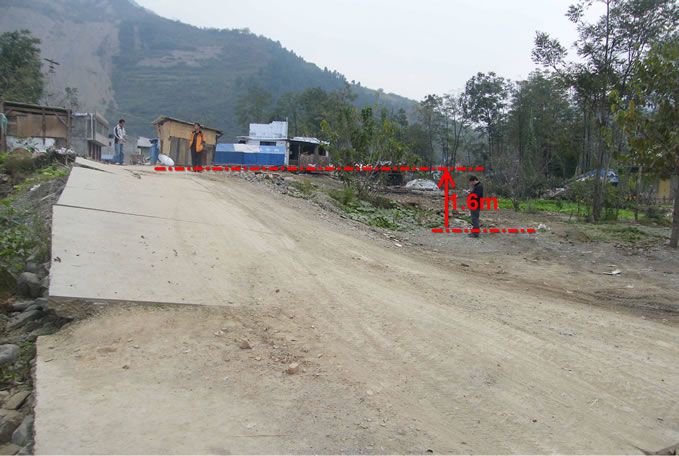
Photo 6. NB-6 thrust dextral, vertical dislocation 1.6 m, located at Hejiaba of Nanba town, Mirror to N40˚E
照片6. 南坝-6逆冲右旋,竖向位错1.6 m,位于南坝镇何家坝村,镜向N40˚E
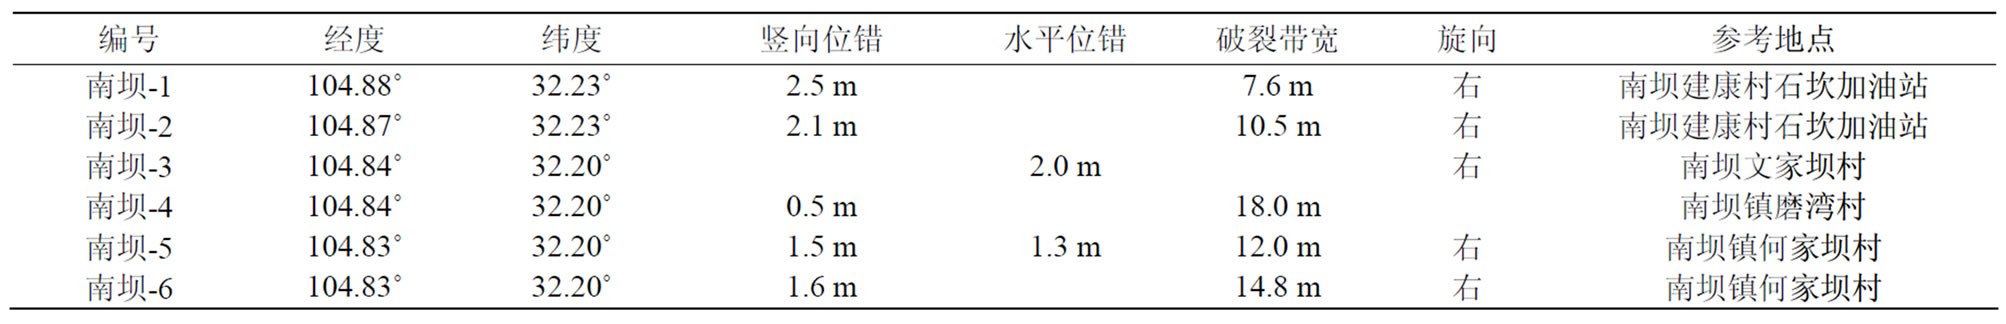
Table 1. Questionnaire of surface rupture site around Nanba town
表1. 南坝镇地表破裂点调查表
2.2. 地表破裂点附近建筑物的震害
地表破裂穿越整个南坝镇人口稠密区,可供调查的房屋较多,结构类型比较齐全,区域考察的房屋破坏数据汇总见附表A。
1) 部分基本完好房屋
房屋基本完好的特点包括:房屋的非承重构件出现轻微开裂。通俗地讲,房屋处于基本完好的房屋稍加修整或不用修整,房屋就可以居住[7]。图2是南坝镇区域内基本完好房屋的分布图,随后列出的是部分完好房屋的照片(7~10)。
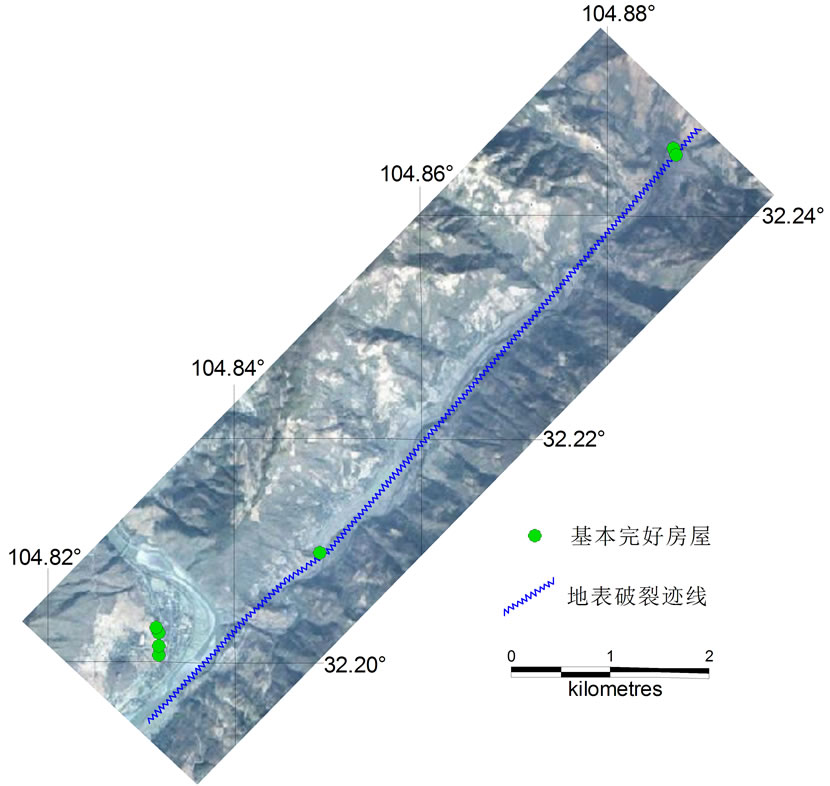
Figure 2. Distribution of basically undamaged structure nearby the surface rupture zone in Nanba town
图2. 南坝镇地表破裂带附近基本完好房屋分布图

Photo 7. w2 windows and doors still can be freely opened, no large cracks, judged to be intact
照片7. w2门窗仍可以自由开启,无大的裂缝,判断为完好建筑

Photo 8. w6 windows and doors still can be freely opened, the bearing structure of no crack occurs, judged to be intact
照片8. w6 门窗仍可以自由开启,承重结构没有出现裂缝,判断为完好结构

Photo 9. w6-1 the detail part of Photo W6, there is not cracks on beam and column
照片9. w6-1 照片w6的细部图片,梁柱无裂纹
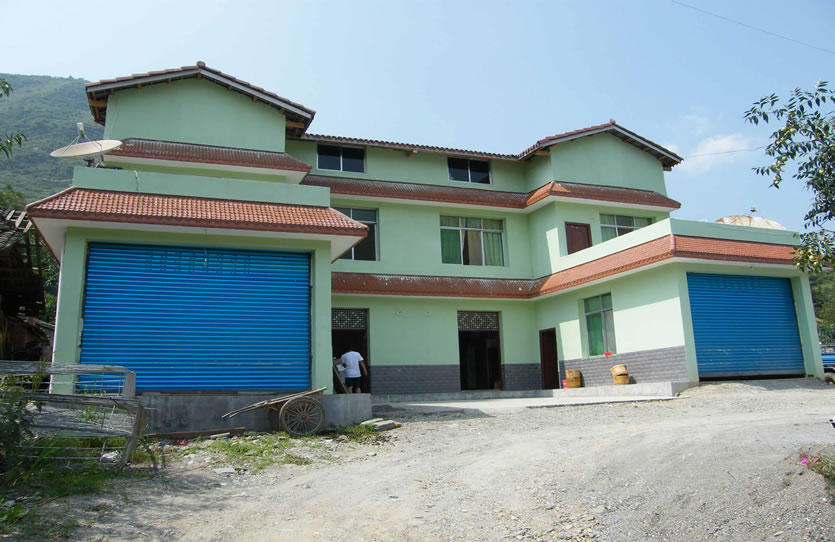
Photo 10. w7 a few frames of the window slight deformation, no large cracks, judged to be intact building
照片10. w7 个别窗框有轻微变形,整体完好,无大的裂缝,判定为完好结构
2) 部分轻微破坏房屋
房屋轻微破坏的基本特点包括:房屋的非承重构件开裂、梭瓦、墙皮开裂等。通俗地讲,房屋轻微破坏的房屋稍加修整,房屋就可以居住[7]。图3是南坝镇区域内轻微破坏房屋的分布图,下面列出的是部分轻微破坏房屋的照片(11~15)。
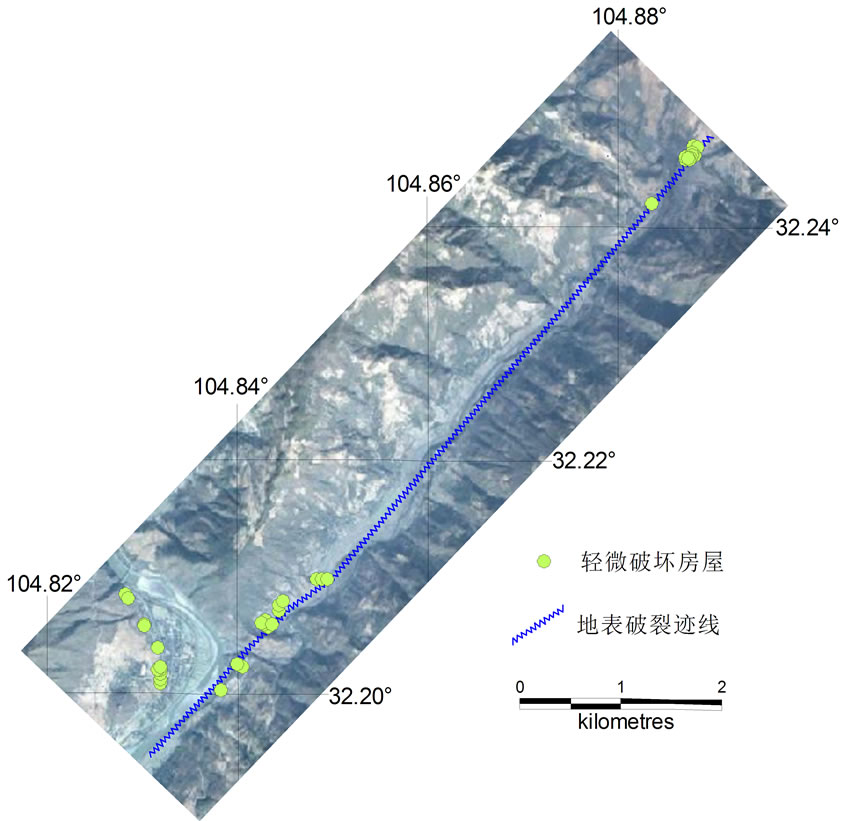
Figure 3. Distribution of slight damaged structure nearby the surface rupture zone in Nanba town
图3. 南坝镇地表破裂带附近轻微破坏房屋分布图
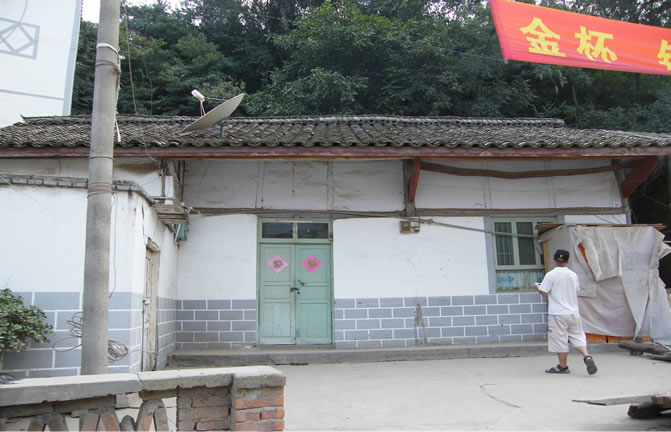
Photo 11. q9 window glass broken, tiles shrunken, but the whole structure largely intact, judged to be slight damaged building
照片11. q9 窗玻璃碎裂,出现缩瓦现象,但结构整体基本完好,判定为轻微破坏
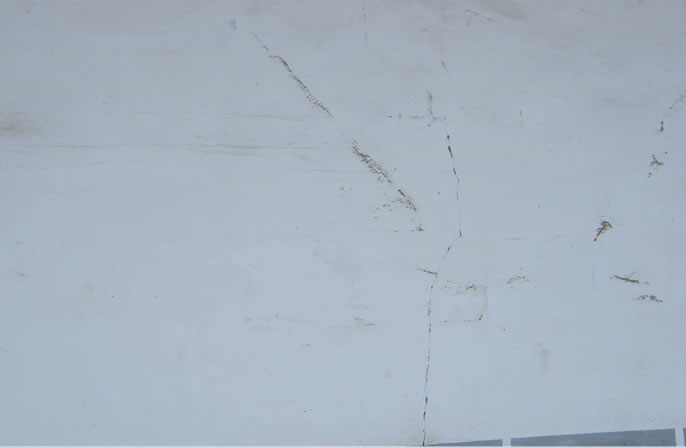
Photo 12. q9-1 the detail part of photo q9, visible small cracks on the wall
照片12. q9-1 照片q9的细部图片,外墙可见小裂缝
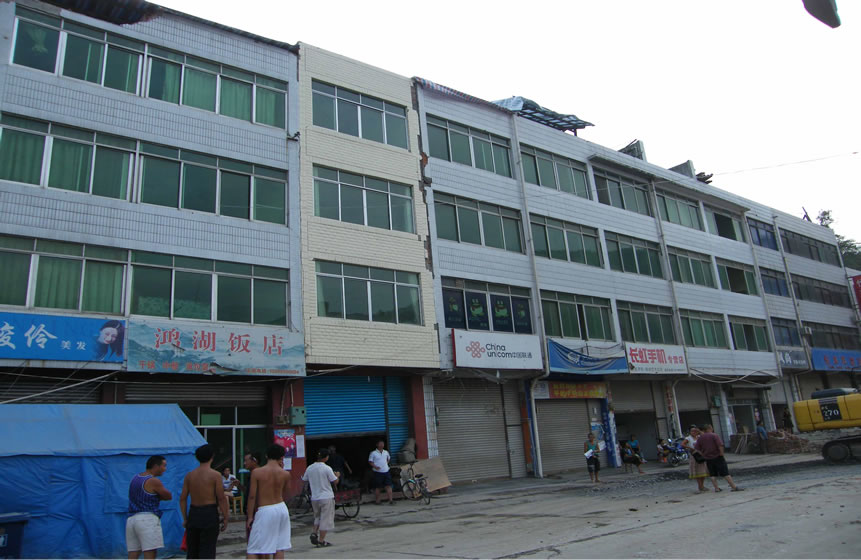
Photo 13. q14 cracks on bearing wall, judged to be slight damage building
照片13. q14 非承重墙有裂纹,结构整体完好。判定为轻微破坏
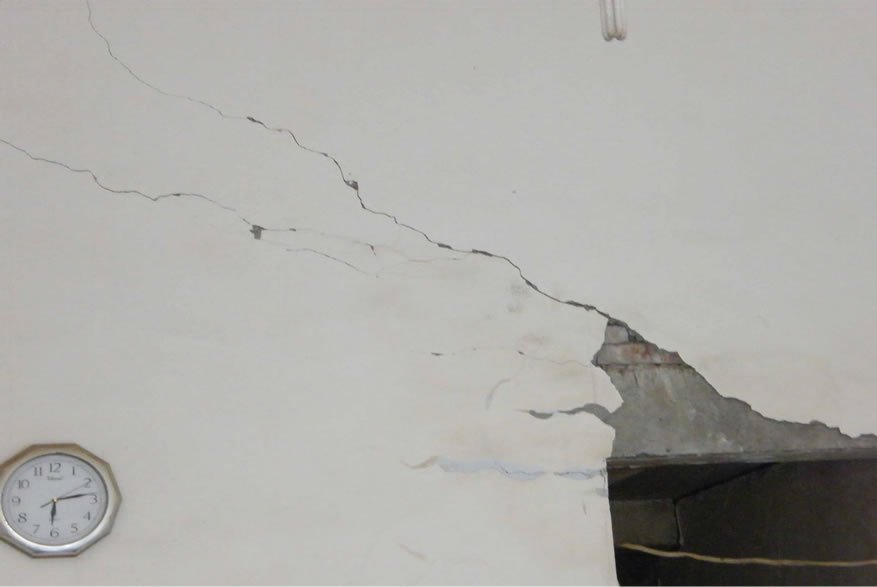
Photo 14. q14-1 the detail part of photo q14, visible cracks on the wall
照片14. q14-1 照片q14的细部图片,内墙可见裂缝
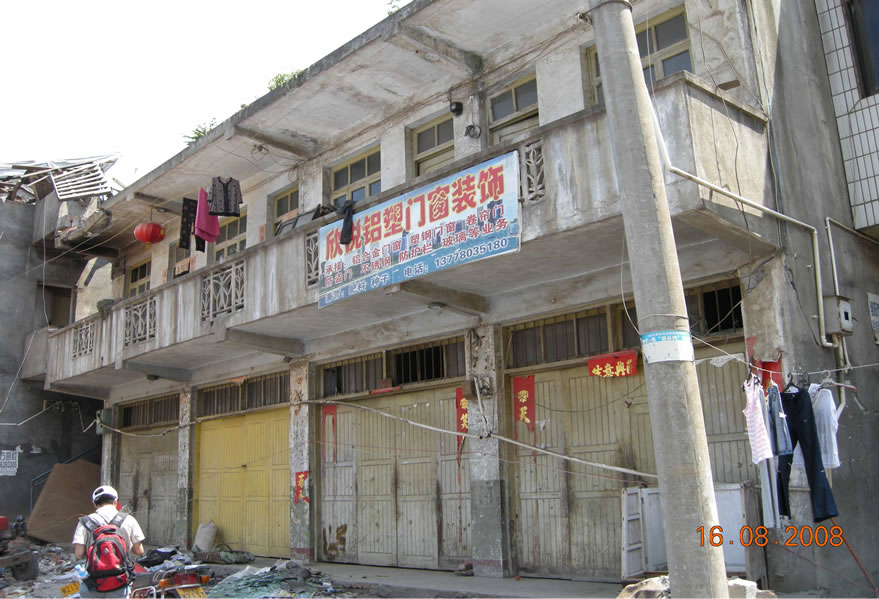
Photo 15. q40 structural integrity, the top is destroyed, judged to be slight damage building
照片15. q40 整体结构完好,顶层破坏严重,判定为轻微破坏
3) 部分中等破坏房屋
房屋中等破坏的基本特点包括:房屋的非承重构件破坏或局部承重墙和承重柱开裂。通俗地讲,房屋中等破坏可以采用有效的加固办法,房屋适合居住[7]。图4是南坝镇区域内中等破坏房屋的分布图,下面列出的是部分中等破坏房屋的照片(16~21)。
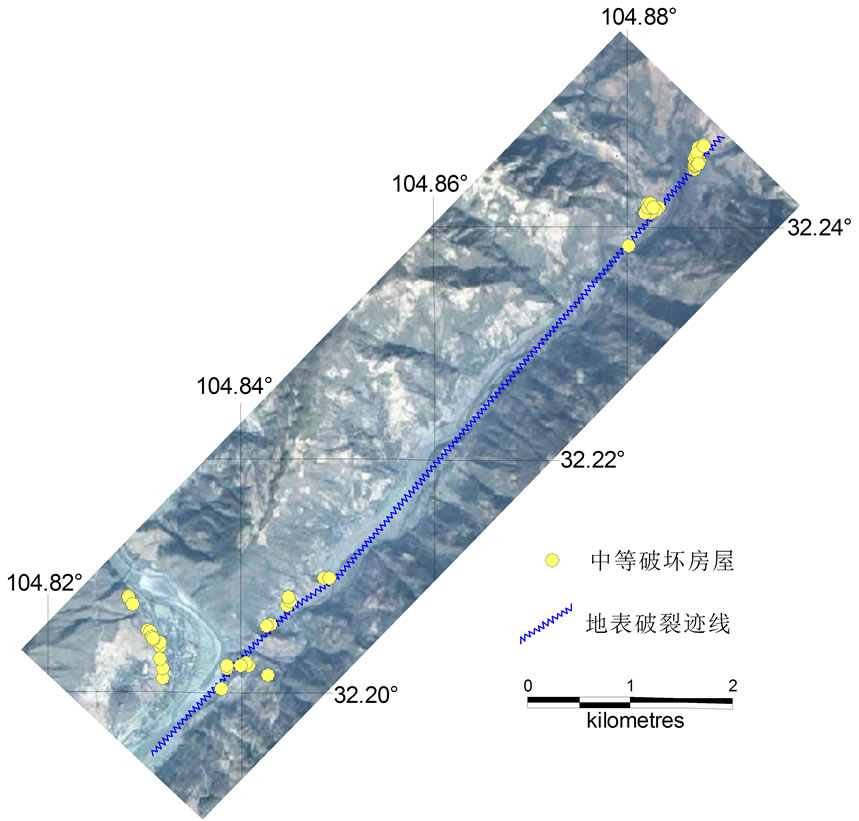
Figure 4. Distribution of medium damaged structure nearby the surface rupture zone in Nanba town
图4. 南坝镇地表破裂带附近中等破坏房屋分布图
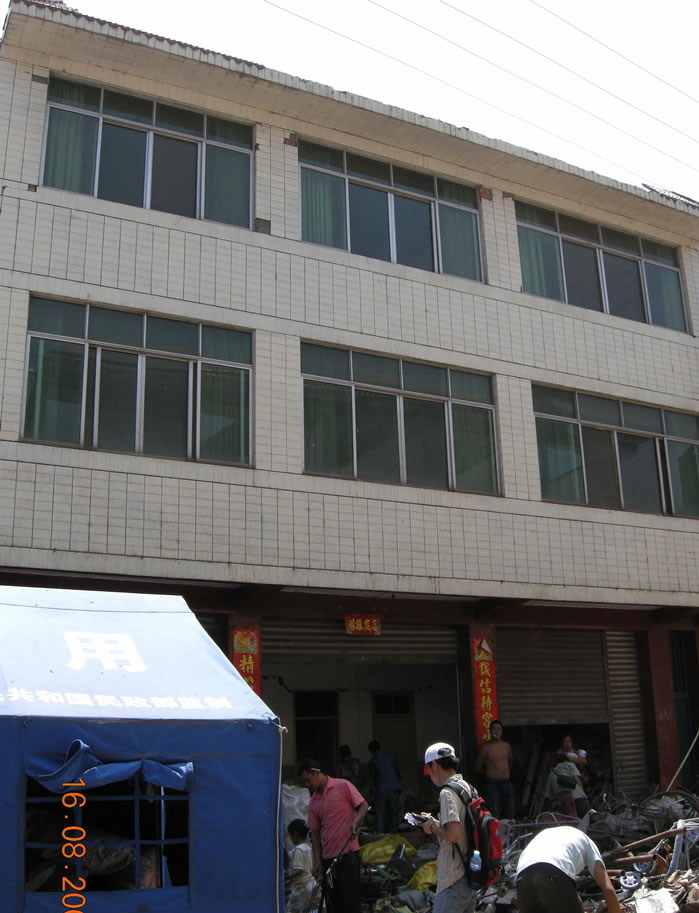
Photo 16. z10 doors and windows intact, visible horizontal cracks on the inner wall, judged to be medium damaged
照片16. z10 门窗完好,但内墙可见横向裂缝,判定为中等破坏

Photo 17. z10-1 the detail part of photo z10, horizontal cracks on the wall
照片17. z10-1 照片z10的细部图片,可见墙体有横裂缝,隔墙破坏

Photo 18. z20 structural integrity, the balcony seriously damaged x cracks on bearing walls, judged to be medium damaged
照片18. z20 房屋结构完整,但阳台损坏较严重,承重墙出现x裂缝,判定为中等破坏
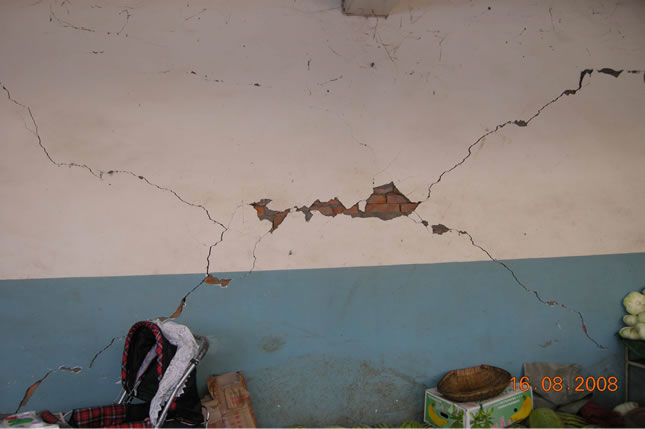
Photo 19. z20-1 the detail part of photo z20, X cracks on bearing walls
照片19. z20-1 照片z20的细部图片,可见承重墙出现X裂缝

Photo 20. z35 structural integrity, doors and windows intact, but horizontal cracks on bearing walls, judged to be medium damaged
照片20. z35 房屋整体结构完整,门窗完好,但内部承重墙出现水平向裂缝,判定为中等破坏
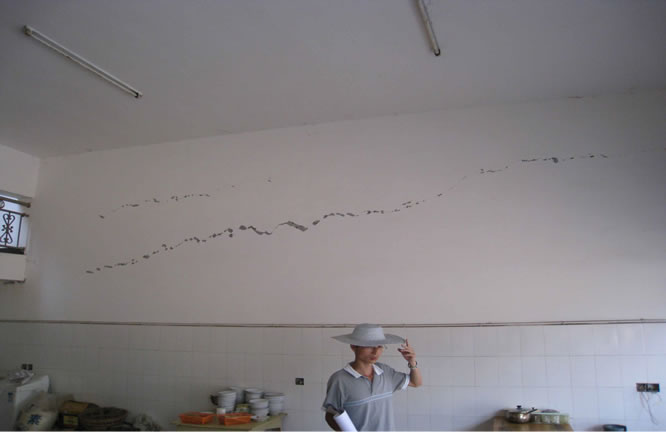
Photo 21. z35-1 the detail part of photo z35, horizontal cracks on bearing walls
照片21. z35-1 z35的细部图片,可见承重墙出现水平贯通裂缝
4) 严重破坏房屋
房屋严重破坏的基本特点包括:房屋的局部承重墙和承重柱破裂,导致房屋局部倒塌;承重墙出现错位、通缝、结构严重变形和扭曲。通俗地讲,房屋严重破坏比倒塌好一些,但找不到有效的办法加固这些房屋,或加固的费用太高至与重建费用相当,这些严重破坏的房屋不再适合居住了[7]。图5是南坝镇区域内严重破坏房屋的分布图,下面列出的是部分严重破坏房屋的照片(22~27)。

Figure 5. Distribution of serious damaged structure nearby the surface rupture zone in Nanba town
图5. 南坝镇地表破裂带附近严重破坏房屋分布图

Photo 22. y17 overall structure slight tilt, large cracks on bearing walls, judged as serious damaged
照片22. y17 整体有轻微倾斜,承重墙出现大裂缝,判定严重破坏

Photo 23. y17-1 the detail part of photo y17, large crack on the wall
照片23. y17-1 照片y17的细部图片,可见一层山墙出现大裂缝
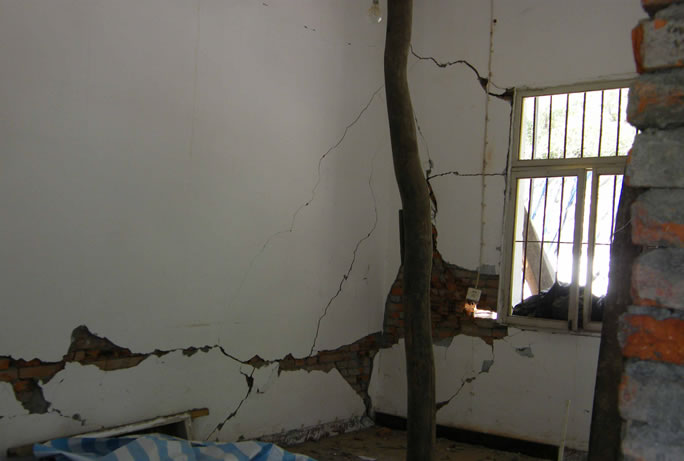
Photo 24. y17-2 the detail part of photo y17, horizontal and vertical cracks on the wall
照片24. y17-2 照片y17的细部图片,可见承重墙出现水平通缝

Photo 25. y39 columns in bottom tilted, judged as serious damaged
照片25. y39 底层柱子倾斜方向不一,柱头损坏严重,判定为严重破坏

Photo 26. y39-1 the detail part of photo y39, steel bars exposed and yielded
照片26. y39-1 照片y39的细部图片,可见柱子钢筋裸露、屈服

Photo 27. y39-2 the detail part of photo y39, overhanging wall in second floor cracked
照片27. y39-2 照片y39的细部图片,可见二层悬挑墙体开裂
5) 倒塌房屋
倒塌的特点就是整体坍塌。倒塌是房屋破坏最严重的一种,倒塌是地震建筑物震害表现出的最残酷一幕,倒塌直接导致大量人员伤亡[7]。图6是南坝镇区域内倒塌房屋的分布图,下面列出的是部分倒塌房屋的照片(28,29)。

Figure 6. Distribution of collapse structure nearby the surface rupture zone in Nanba town
图6. 南坝镇地表破裂带附近倒塌房屋分布图

Photo 28. d17 most structural damage, beyond repair, judged as collapse
照片28. d17 大部分结构构件损毁,无法修复,判定为倒塌
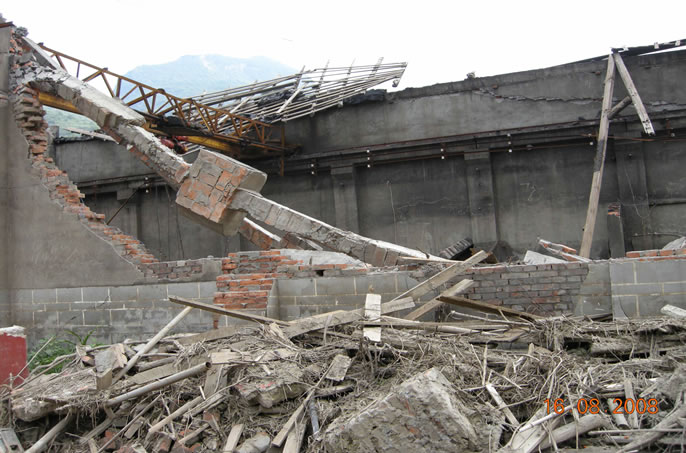
Photo 29. d30 most structural damage, the roof collapsed, judged as collapse
照片29. d30 大部分结构构件损毁,屋面整体倒塌,判定为倒塌
2.3. 建筑物震害与断层距的关系
断层距定义为建(构)筑物与断层地表破裂迹线的距离。断层距计算采用如下方法,通过坐标转换公式将GPS点坐标转换成高斯坐标,将地震地表破裂点在小区域范围内连成直线,求解地表破裂迹线在高斯直角坐标系下的方程,最后利用点到直线的距离公式求得建筑物到地表破裂迹线间的距离。
本区垂直位错2.5 m,水平位错2 m。建筑物的倒塌率和完好率与地表破裂迹线距离的关系见图7。图中表明,50 m范围内的房屋完好率为0,倒塌率为0.424。
3. 所有数据的统计分析
应用地震破裂带上的15个破裂点周围的1699栋建筑物/构筑物的震害评估的结果进行统计分析[8-11](破裂点有小鱼洞、高原、深溪沟、草坝、汉旺镇、岳家山、蓥华镇、金花镇、八角镇、白鹿镇、擂鼓镇、桂溪乡、南坝、建康、平通)。
3.1. 倒塌率和完好率
从图8可以看出,在距地表破裂迹线距离为150 m范围内的建筑物的倒塌率逐渐下降;在距地表破裂迹线距离为250 m范围内的建筑物的完好率逐渐上升;超过这样的区域,倒塌率和完好率趋于平缓。
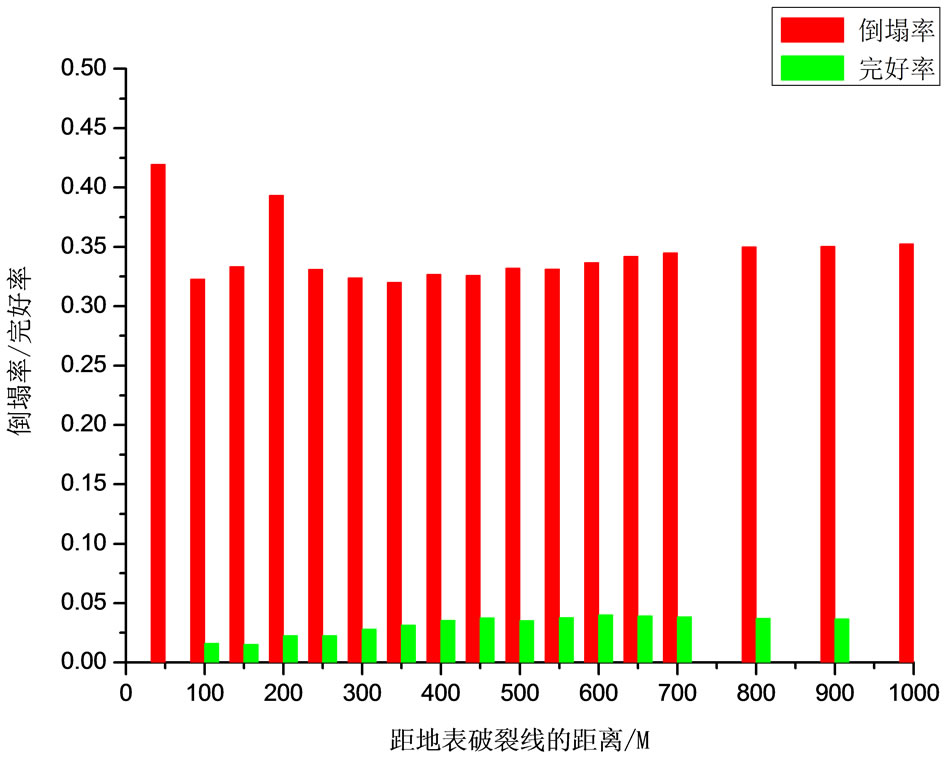
Figure 7. Relationship between the rate of collapse/intact and the distance from structures to surface rupture line in Nanba town. The red column map expressed rate of collapse and the green expressed intact rate
图7. 南坝镇区域内房屋倒塌率/完好率与建筑物离开地表破裂线的距离之间的关系

Figure 8. Relationship between the rate of collapse/intact and the distance from structures to surface rupture belt line. The red column map expressed rate of collapse and the green expressed intact rate
图8. 调查范围内房屋倒塌率/完好率与建筑物离开地表破裂线的距离之间的关系
3.2. 震害指数
把建筑物的破坏等级转化为震害指数[12],见表2,可以得到汶川8.0级地震各个区域内平均震害随断层距的关系,见图9。
指定范围内的震害指数是不同震后房屋破裂状态比率与房屋破裂状态对应的震害指数乘积之和。
范围内的建筑物的震害指数逐渐下降;超过这样的区域,震害指数规律性不明。
3.3. 建筑物震害沿地表破裂迹线的分布
基于上述方法,计算了15个地表破裂调查点断层距为50 m范围内的倒塌率/完好率、震害指数,见图10和图11。需要说明,科考工作时映秀镇和北川县城已管制,没有详实的调查数据,宏观确定这两区域的50 m范围内建筑物倒塌率为0.7,相应震害指数估测为0.86。
4. 结论
1) 地表破裂附近建/构筑物的倒塌源于强地震动和地表破裂或地表永久位移,两者破坏的机制是不同的。强地震动主要引起建筑物的强烈振动,当建筑结构的整体刚度丧失时,导致建筑物的倒塌;地表破裂引起建筑物的倾斜。两者对地表破裂附近建/构筑物破坏的贡献都比较大。

Table 2. The contrast table of seismic damage index and the earthquake disaster index of the building
表2. 震害指数与建筑物破坏对照表
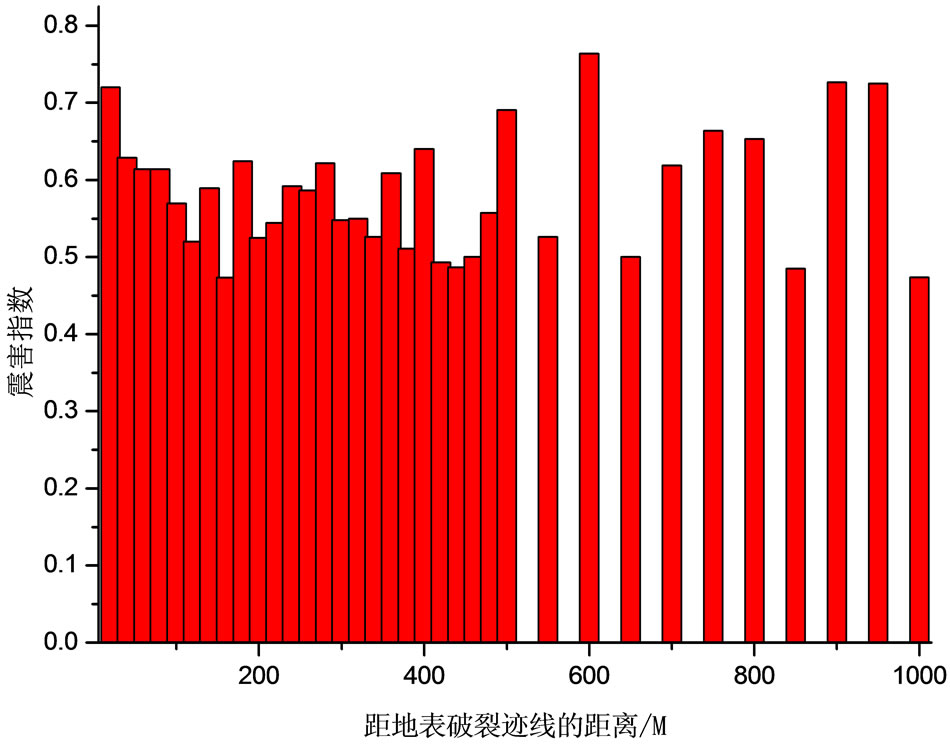
Figure 9. Relationship between the earthquake disaster index of the building and the distance from structures to surface rupture line
图9. 调查范围内房屋震害指数与建筑物离开地表破裂线距离之间的关系
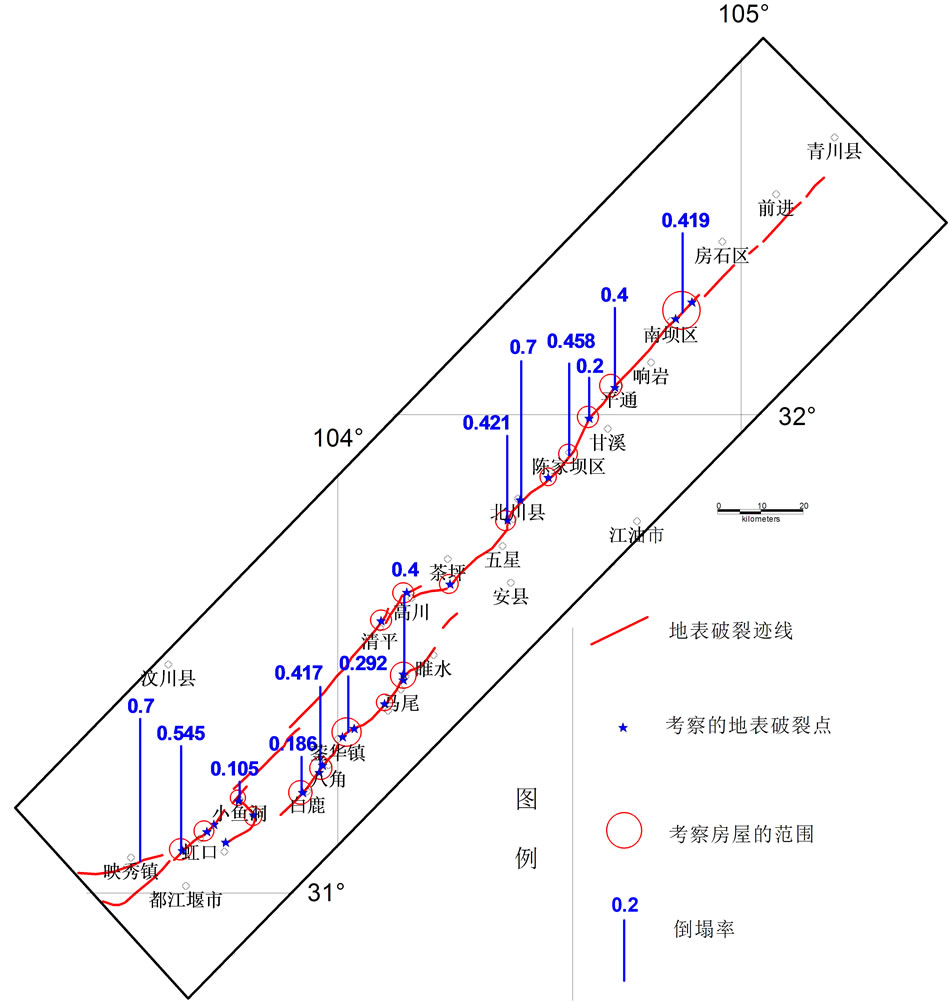
Figure 10. Map shows the distribution of the rate of collapse along the surface rupture trace (The rate of collapse in the range of 50 m between building and surface rupture trace list out in diagram, but it is showed that the estimated value 0.7 in Beichuan and Yingxiu town, and other value was calculated from investigation data)
图10. 建筑物倒塌率沿地表破裂迹线的分布图(图中标示的数字是地表破裂线50 m范围内房屋的倒塌率,其中映秀镇和北川县城的数值0.7是宏观估算值,其他数值都是采用现场调查资料计算得出的)

Figure 11. Map shows the distribution of the earthquake disaster index of the building along the surface rupture trace (The seismic damage index in the range of 50 m between building and surface rupture trace list out in diagram, but it is showed that the estimated value 0.86 in Beichuan and Yingxiu town, and other value was calculated from investigation data)
图11. 汶川地震地表破裂带附近建筑物震害指数沿地表破裂迹线的分布图(图中标示的数字是地表破裂带周围50 m范围内建筑物破坏的平均震害指数,其中映秀镇和北川县城的震害指数为宏观估测值)
2) 现场调查发现,地表破裂或地表永久位移引起建筑物倒塌范围非常有限,一般距地表破裂迹线两侧各50 m范围内,但在地表破裂转弯处,影响范围可达200~300 m;由于很难把强地震动和地表破裂两者共同作用剥离开来,地震地表破裂迹线两侧的建筑物显著倒塌范围为150 m。
3) 整体看来,老旧民房倒塌严重,近年新建的建筑物倒塌率稍低;砖混结构的倒塌率高于混凝土结构。因此,建筑结构的稳定性是房屋倒塌的重要原因。
4) 考察地表破裂附近建筑物的震害,既需要地表破裂的出露,又需要附近有居民点,但由于这次地震发生在高原与平原的过渡地带,沿地表破裂带上的居民点分布很不均匀。因此,这样就限定建筑物调查的数量,调查结果也就有一定局限性。
5) 地表破裂附近建筑物的震害与地表破裂或地表永久位移分布有较强的关联性,可为震源参数的反演提供佐证。
参考文献 (References)
[1] 徐锡伟, 闻学泽, 叶建青等. 汶川Ms8.0地震地表破裂带及其发震构造[J]. 地震地质, 2008, 30(3): 597-629.
[2] 赵纪生, 师黎静, 吴景发等. 汶川8.0级地震地表破裂迹线附近建筑物震害科考报告[R]. 中国地震局工程力学研究所, 2009
[3] 赵纪生, 周正华. 灾后城镇重新选址的地震地质灾害评估纲要[J]. 世界地震工程, 2008, 24(2): 26-31.
[4] 周荣军, 黄润秋等. 四川汶川8.0级地震地表破裂与震害特点[J]. 岩石力学与工程学报, 2008, 27(11): 2173-2183.
[5] 张加桂, 唐锐敏等. 汶川地震震害特点及成因探讨[J]. 第四纪研究, 2009, 29(3): 565-573.
[6] GB/T 18208.3-2000中华人民共和国国家标准. 地震现场工作第三部分: 调查规范[S]. 北京, 2000,.
[7] GB 18208.2-2001中华人民共和国国家标准. 地震现场工作第二部分: 建筑物安全鉴定[S]. 北京, 2001.
[8] A. Lin, T. Ouchi, A. Chen, et al. Co-seismic displacements, folding and shortening structures along the Chelungpu surface rupture zone occurred during the 1999 Chi-Chi (Taiwan) earthquake. Tectonophysics, 2001, 330(3-4): 225-244.
[9] E. J. Fielding, M. Talebian, P. A. Rosen, et al. Surface ruptures and building damage of the 2003 Bam, Iran, earthquake mapped by satellite synthetic aperture radar interferometric correlation. Journal of Geophysical Research, 2005, 110: B03302.
[10] A. Aydin, D. Kalafat. Surface ruptures of the 17 August and 12 November 1999 Izmit and Duzce earthquakes in Northwestern Anatolia, Turkey: Their tectonic and kinematic significance and the associated damage. Bulletin of the Seismological Society of America, 2002, 92(1): 95-106.
[11] R. Bilham. An seismic hazard. Science, 2001, 293(5534): 1442- 1444.
[12] 胡聿贤. 地震工程学[M]. 北京: 地震出版社, 1989.
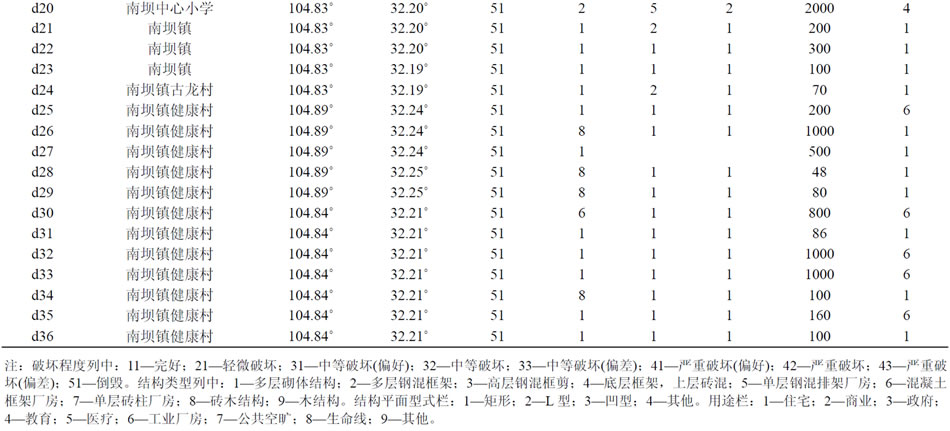

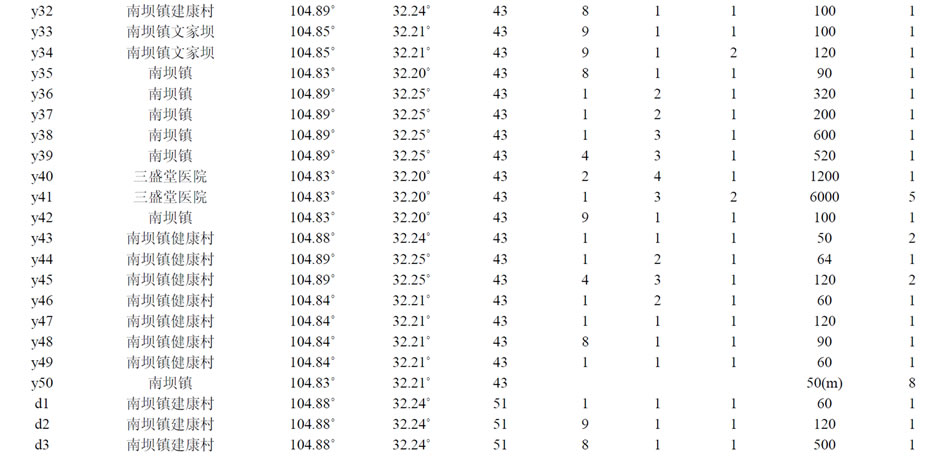


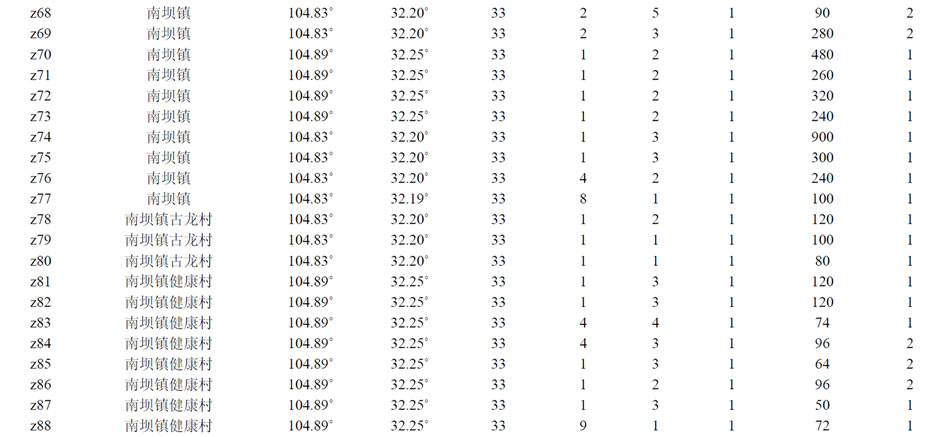
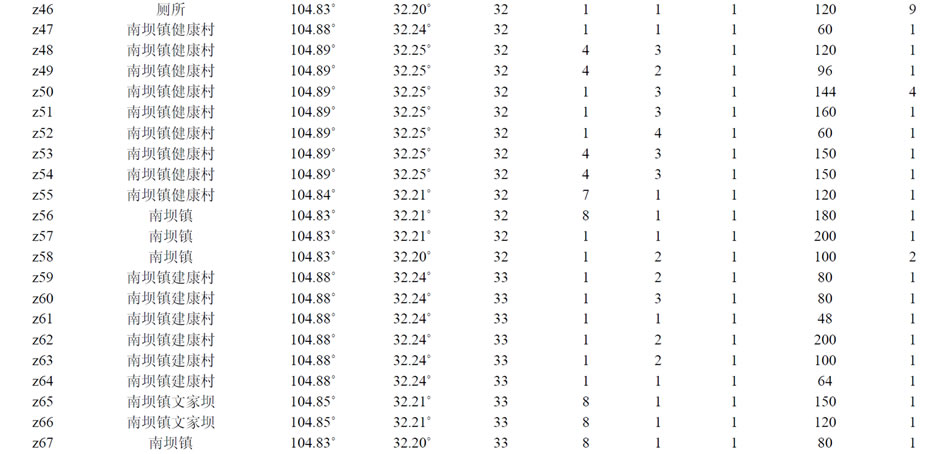


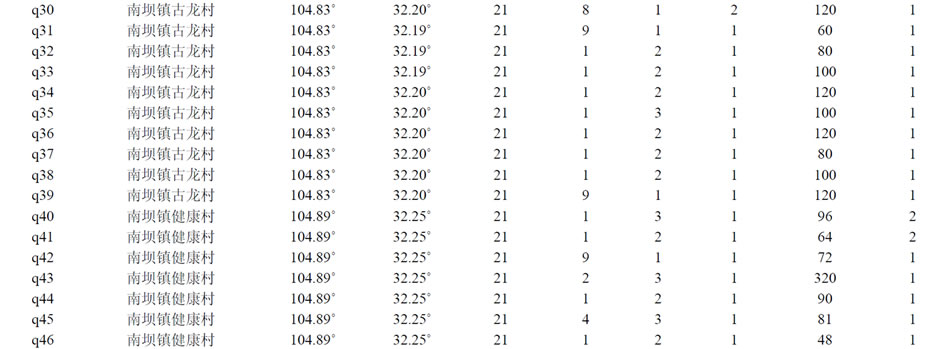
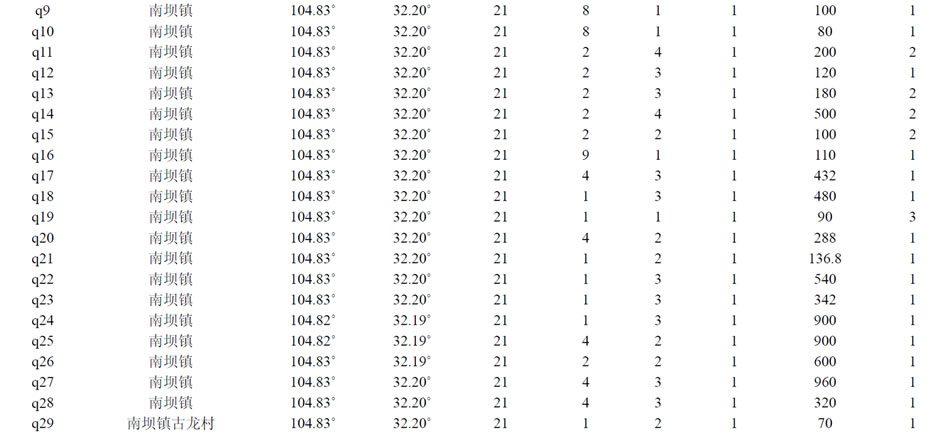
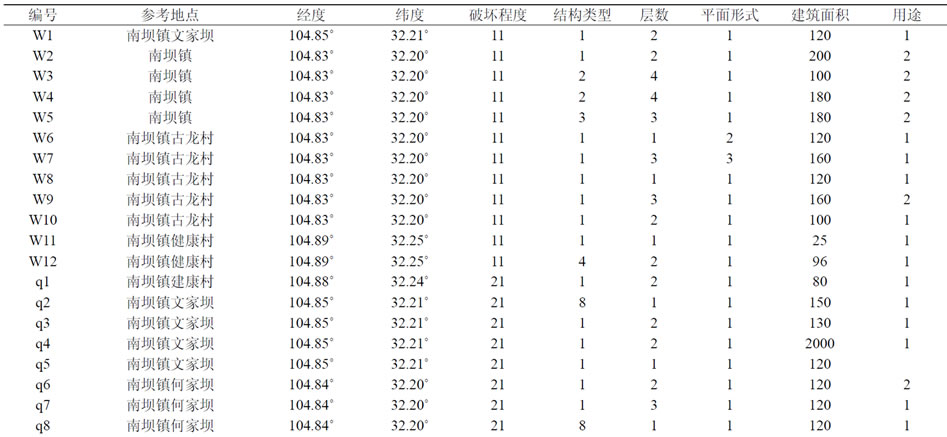
Table A. Collecting table of damaged structures in Nanba town
附表A. 南坝镇区域内房屋破坏数据汇总表
NOTES
*资助信息:本文是在国家国际科技合作计划(2011DFA21460)和地震行业科研专项(201108003)资助下完成的。