Advances in Marine Sciences
Vol.
06
No.
02
(
2019
), Article ID:
30122
,
15
pages
10.12677/AMS.2019.62003
Nitrogen Isotope Characteristics of Suspended Particles in the South Yellow Sea
Maojun Yan1, Shuhang Dong1, Xiaosong Zhong1, Xiaoyan Ning2, Yu Xin2*
1Collehe of Chemistry and Chemical Engineering, Ocean University of China, Qingdao Shandong
2Key Laboratory of Marine Chemistry Theory and Technology Ministry of Education, Ocean University of China, Qingdao Shandong

Received: Apr. 16th, 2019; accepted: May 2nd, 2019; published: May 9th, 2019

ABSTRACT
Yellow Sea is a semi-enclosed marginal sea that is significantly impacted by human activities. One of the major characteristics of Yellow Sea is the long-term existence of intensive cold water mass in summer. We analyzed the organic carbon and nitrogen content and isotope of the suspended particulate matter in South Yellow Sea in summer, 2016. We focus on the spatial variances in particulate nitrogen content, isotope character and the controlling factors respectively in coastal waters and cold water masse realm. In the coastal waters, the particulate nitrogen (PN) is comparatively higher and the vertical variances of nitrogen isotope (δ15NPN) are small. In central south Yellow Sea where cold water masses exists, the PN is characterized of low content, significant vertical variances in δ15NPN. We further run environmental factors analysis, and found out that the spatial variances of particulate nitrogen content and nitrogen isotopes in the South Yellow Sea was mainly controlled by the assimilation, vertical mixing in water column and mineralization.
Keywords:Southern Yellow Sea, Suspended Particulate Matter, Nitrogen Isotope
南黄海水体悬浮颗粒氮同位素特征
晏茂军1,董书航1,钟晓松1,宁晓燕2,辛宇2*
1中国海洋大学化学化工学院,山东 青岛
2中国海洋大学海洋化学理论与工程技术教育部重点实验室,山东 青岛

收稿日期:2019年4月16日;录用日期:2019年5月2日;发布日期:2019年5月9日

摘 要
黄海是人类活动影响显著的半封闭陆架边缘海,在夏季存在特征鲜明的冷水团结构。本文通过分析2016年夏季南黄海水体颗粒物氮含量及同位素,探讨南黄海近岸海域和冷水团海域颗粒氮分布差异和影响因素。近岸海域颗粒氮(PN)呈现出含量较高、氮同位素值(δ15NPN)垂向差异较小的分布特征;冷水团海域PN呈现出含量低、δ15NPN垂向差异显著的分布特征。通过结合环境因子分析,发现南黄海海域颗粒氮及同位素分布主要受到同化吸收、水体动力过程和矿化过程等过程共同调控。
关键词 :南黄海,悬浮颗粒物,氮同位素

Copyright © 2019 by author(s) and Hans Publishers Inc.
This work is licensed under the Creative Commons Attribution International License (CC BY).
http://creativecommons.org/licenses/by/4.0/


1. 引言
本氮循环是海洋生物地球化学循环重要组成部分,一直是海洋科学研究的热点 [1] [2] [3]。在氮循环转化过程中往往伴随有氮同位素(14N/15N)的分馏 [4] [5],造成产物和剩余底物具有不同的氮同位素值(δ15N)。因此分析不同形态的氮元素的δ15N特征(图1)为氮循环过程研究提供了有效的示踪方法 [6]。
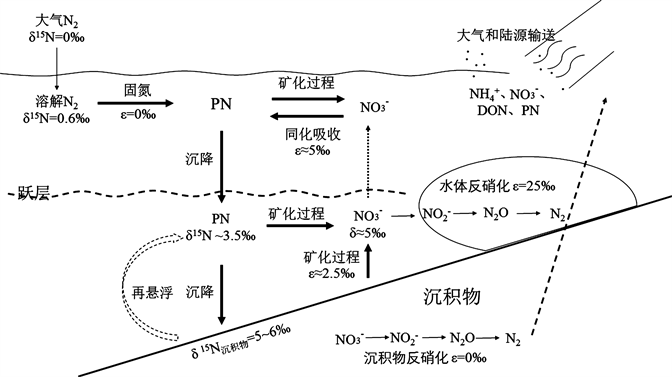
Figure 1. Key steps in marine particulate nitrogen cycle [6] [21]
图1. 海洋水体颗粒氮主要氮循环过程 [6] [21]
海洋水体悬浮颗粒物(Suspended particulate matter, SPM)具有易降解、循环速度快(1~2周)的特点,悬浮颗粒氮(PN)虽然仅占海洋总氮库的0.5%,但是海洋氮库的重要组成部分 [7]。颗粒氮主要来源包括海洋浮游植物及死亡后碎屑、陆源输入、大气沉降、生物固氮等 [5],不同来源的颗粒氮其同位素值(δ15NPN)存在显著差异 [8] [9] (图1)。浮游植物是海洋颗粒氮的主要来源之一,在同化吸收硝酸盐过程中氮同位素会发生分馏 [5]。对于一些固氮生物,固氮过程氮分馏较弱,所以δ15N一般与大气接近,比如北大西洋固氮硅藻δ15N为−1‰~−2‰ [8],而在氮限制海域由于硝酸盐几乎完全被吸收分馏过程不明显。因此δ15NPN的时空分布特征与浮游植物初级生产有一定的对应关系 [6] [10] [11]。海洋中颗粒氮一部分会降解转化为无机态氮为浮游植物提供氮营养盐,在降解过程中,一般会优先释放出14N而剩余颗粒物富集15N [12] [13],另一部分会经过一系列絮凝、吸附和解吸等最终沉降到海底形成沉积物 [4] [14],海水–沉积物界面的再悬浮过程也会促进颗粒氮的降解和转化,进一步改变了颗粒物δ15N [15] [16] [17]。因此颗粒物δ15NPN反映了氮元素在海洋中的源、汇以及转化过程,所以海洋颗粒物δ15N的时空分布和调控机制一直是海洋氮循环的重要研究方向 [11] [18] [19] [20]。特别是在受人类活动影响显著的近海海域,颗粒氮含量较高且同时受到多重因素共同影响,其循环转化过程研究具有重要的科学意义。
黄海是我国一个半封闭性陆架浅海,位于中国大陆与朝鲜半岛之间。黄海平均水深44 m,最大水深140 m [22]。黄海主要受长江冲淡水、苏北沿岸流和黄海暖流等水系共同影响。特别在夏季,受季风及地形影响,黄海中部海域水体层化形成近底层特征低温的黄海冷水团 [23] [24]。
近些年近岸海域由于大规模水产养殖和陆源污染物输送造成氮磷营养结构显著改变,近岸水体富营养化现象严重 [25],赤潮、绿潮等生态灾害频发 [26],上述变化对黄海的氮循环过程影响显著 [27] [28]。然而目前对南黄海氮循环的研究主要围绕营养盐结构 [25] [29] [30] 、悬浮颗粒物输送 [31] [32] [33] 和沉积物迁移等方面。对颗粒氮循环的研究也主要集中在浓度以及分布上,而对诸多生物和物理过程研究匮乏。实际上,黄海海域受陆源输入、大气沉降等影响,氮来源复杂,而且近海物理过程复杂,并且与生物过程相互叠加,不能很好地区分单一的氮循环过程。因此需要更准确的示踪手段(如氮同位素示踪技术)来研究黄海颗粒物氮循环过程。目前仅有刁明亚 [34] 对夏季南黄海两个断面(10个站位)的颗粒物和浮游植物碳、氮同位素进行了分析,揭示了陆源长江冲淡水和黄海冷水团对颗粒有机物和浮游生物碳、氮同位素组成与分布的影响。但是仍然缺乏对南黄海颗粒氮的空间分布、调控机制的深入研究。
针对我国南黄海颗粒氮及其同位素分布特征和调控机制,本文利用氮稳定同位素示踪,通过测定夏季南黄海悬浮颗粒物碳、氮同位素并结合环境因子分析,旨在:1) 准确刻画南黄海海域颗粒氮及其同位素的空间分布和变化特征;2) 探究南黄海典型区域(近岸和冷水团)颗粒物氮的转化和降解过程。
2. 数据与方法
2.1. 数据组成及来源
通过搭载2016年夏季“国家自然科学基金委黄渤海共享航次”(2016年6月28日~7月6日),在南黄海海域采集水体样品和悬浮颗粒物样品,采样站位分布于32˚N~36˚N,121˚E~124˚E,共计42个站位(图2)。温度、盐度、深度数据由船载CTD (SeaBird 911,美国)测定,溶解氧和水体荧光强度由CTD加载溶解氧探头和荧光探头测定。
水体样品是由船载CTD (SeaBird 911,美国) 12升Niskin采水器获取,经0.45 μm醋酸纤维膜过滤后储存于125 ml高密度聚乙烯瓶(Nalgene HDPE,美国Thermo公司)并−20℃保存至营养盐测定;颗粒物样品是准确量取一定体积海水经GF/F膜(0.7 µm,25 mm,Whatman,美国,马弗炉500℃烧5小时并在干燥器恒湿24 h后称重至使用)过滤并取双样,过滤后滤膜放置于洁净铝箔中,在船载烘箱45℃干燥24小时后−20℃保存。
2.2. 研究方法
水体样品营养盐(硝酸盐、亚硝酸盐、磷酸盐、硅酸盐)通过营养盐自动分析仪(QuAAtro,德国Seal

Figure 2. Spatial distribution of sampling sites in south Yellow Sea. The circulation regimes and main water masses are also indicated, including the Yellow Sea Coastal Current (YSCC), the Korean Coastal Current (KCC), the Changjiang Diluted Water (CDW) and Yellow Sea Cold Water Mass (YSCDM) [35] . A and B stand for two sections in 36˚N and 35.5˚N
图2. 南黄海采样站位分布图。南黄海主要海流和水团:黄海沿岸水(YSCC)、朝鲜沿岸水(KCC)、长江冲淡水(CDW)和黄海冷水团(YSCWM) [35] ;A、B为35°N和36°N两个断面
公司)测定,铵盐采用Holmes等 [36] 方法随船测定。硝酸盐、亚硝酸盐、磷酸盐、硅酸盐、铵盐检出限分别是0.06 μmol/L,0.01 μmol/L,0.03 μmol/L,0.15 μmol/L,0.02 μmol/L,精密度小于3% [37]。颗粒物样品在陆地实验室干燥器恒湿24小时后称重(十万分之一电子天平,Sartorious,德国) GF/F膜过滤样品前后质量,差减计算得到悬浮颗粒物含量。膜样用浓盐酸酸熏12小时除去无机碳 [38],然后使用Elementar元素分析仪(Elementar,德国)串接IsoPrime同位素比质谱仪(IsoPrime,英国)测定颗粒物碳、氮含量和同位素。碳氮同位素标准是国际同位素标准咖啡因(IAEA-600, δ13C = −27.77‰, δ15N = 1.00‰)和USGS40 (δ13C = −26.39‰,δ15N = −4.50‰),碳氮含量标准是乙酰苯胺(TC% = 71.02%,TN% = 10.36%)和土壤标准(GBW07314,国家海洋局第二研究所)。对于各个参数的检出限和精密度分别为:TN (>10 μg, <4%; >20 μg, <2%)、POC (>150 μg, <4%; >200 μg, <2%),δ13C和δ15N精密度分别为0.2‰和0.3‰。在后续分析讨论中对颗粒氮含量表达方式有两种,其中PN代表颗粒氮在水体中的浓度(μg/L),PN%代表颗粒氮占颗粒物质量的百分比(%)。
3. 结果
3.1. 南黄海水文特征
研究海域表层温度范围为18.3℃~24.1℃,低值区在靠近山东半岛东南海域和长江口北部附近,高值区出现在南黄海中部和苏北近海。表层盐度范围为23.6~32.6 psu,总体呈现北部高南部低的趋势,低值区在长江口外海域,,高值区出现在南黄海中部。底层温度范围为7.3℃~23.1℃,高值区在长江口和江苏沿岸,低值区在南黄海中部。底层盐度变化范围为29.8℃~33.3℃,与表层相似总体也呈现南黄海中部高,近岸低的趋势(图3)。
3.2. 悬浮颗粒物颗粒有机碳(POC)和颗粒氮(PN)及其同位素分布
研究海域POC含量范围为45~1000 μg/L。POC表层在长江口东北部有最高区,在苏北外海有次高值区,在南黄海中部海域含量普遍较低。底层在长江口附近及苏南近岸有高值区,在苏南近岸和南黄海中

Figure 3. Spatial distribution of temperature and salinity in surface ((a), (b)) and bottom ((c), (d)) in South Yellow Sea
图3. 南黄海表底层温度((a)、(b))和盐度((c)、(d))分布
部含量普遍较低。PN分布趋势与POC相似,表层含量范围为9~193 μg/L,总体呈现近岸高、外海低的趋势。底层高值区在长江口附近,南黄海中部海域普遍较低(图4)。
颗粒有机碳同位素值(δ13CPOC)范围为−26.92‰~−19.14‰,平均值为−23.35‰ (n = 144)。δ13CPOC表底层分布趋势相似,总体呈现近岸高、外海低的分布特征,高值区在江苏外海和长江口海域,低值区在南黄海中部海域。颗粒氮同位素值(δ15NPN)分布范围为−0.16‰~7.40‰,平均值为3.43‰ (n = 140)。表底层分布差异较大,表层高值区在长江口附近,低值区在南黄海中部海域。底层最高值在南黄海中部,向四周总体呈现递减趋势,在苏北近岸和长江口附近又略微升高。
4. 讨论
黄海在夏季一般具有鲜明的特征冷水团环境,且初级生产力维持在较高水平(316 ± 277 mgC/m2 [39] ),海洋(微)生物过程较为旺盛,因此夏季是研究黄海颗粒氮源、汇和循环转化过程的最佳时期。针对于黄海颗粒氮同位素空间分布特征和调控机制,本文在讨论4.1部分对航次调查期间南黄海环境特征进行分析,明确南黄海水团划分和环境因子空间分布特征;在4.2部分结合环境因子分析结果对南黄海海域颗粒氮和氮同位素空间分布的影响因素开展讨论,重点围绕氮同位素特征如何示踪主要调控过程。
4.1. 夏季南黄海环境特征
4.1.1. 夏季南黄海水团特征分析
从底层温度和盐度可以看出(图3),在航次调查时期,南黄海中部存在低温、高盐的特殊水团结构,表明底层已经形成了比较稳定的冷水团结构 [40]。在调查站位中,A、B两个断面较为完整的覆盖了从近岸到黄海中部冷水团的海域,其断面温、盐剖面能够较好的反映出冷水团与近岸水体温、盐结构差异(图5),

Figure 4. Spatial distribution of POC ((a), (b)), PN ((c), (d)), δ13CPOC ((e), (f)) and δ15NPN ((g), (h)) in surface and bottom
图4. 南黄海表、底层颗粒物POC((a)、(b))、PN((c)、(d))及碳((e)、(f))、氮((g)、(h))同位素分布
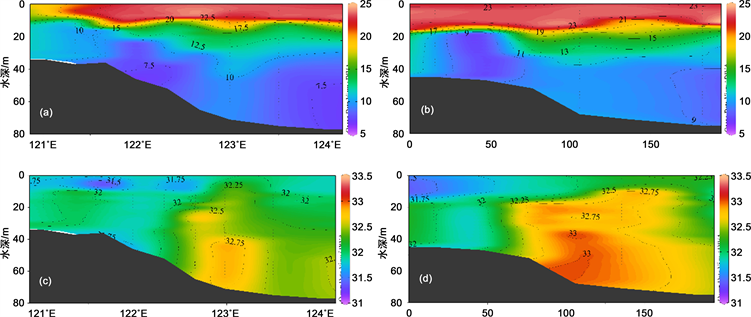
Figure 5. Vertical distribution of temperature ((a), (b)) and salinity ((c), (d)) in section A and B
图5. A、B断面温度、盐度断面分布
可以看出在10 m~20 m的温跃层以下,很明显地存在两个低于8℃的“冷核”,表明调查海域已经形成了冷水团结构 [41]。冷水团海域站位表底层温差为13.5℃~16.4℃,平均值14.6℃ ± 0.9℃ (n = 14),相对以往研究结果偏高 [42] [43],说明冷水团海域水体温跃层强度加强,冷水团结构更加稳定。冷水团底层平均盐度为32.7 psu,与以往研究结果相比偏低,与李昂 [42] 南黄海冷水团盐度呈逐渐下降趋势的研究结果一致。
4.1.2. 南黄海环境参数主成分分析
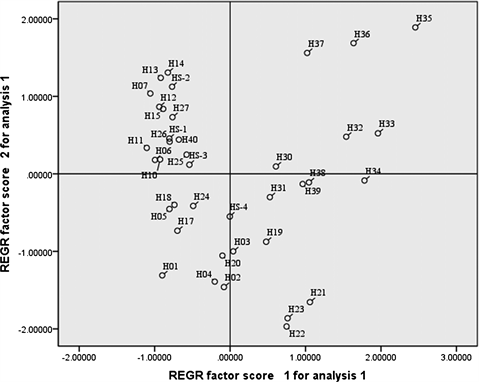
为分析各个站位的底部环境特征对悬浮颗粒物沉降及再悬浮的影响,本文对各站位底层各项环境参数(水深、温度、盐度、浊度、溶解氧、荧光值、密度、TAU、POC、SPM、PN、δ13CPOC、δ15NPN和五项营养盐)进行主成分分析(SPSS 22.0,美国),得到3个主成分,解释环境参数空间变化的80%。以第一和第二主成分在每个环境参数主成分得分为坐标轴作图并标识站位名称,得到图6(a)。第二象限诸点都分
 (a)
(a)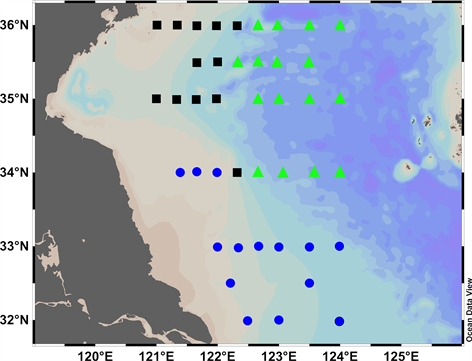 (b)
(b)
Figure 6. Principal component analysis of bottom environment (a) and water masses (cold water masses station with green triangle, inshore station with blue circle and black square)
图6. 南黄海底层环境参数主成分分析(a)及划分水团(b)其中,绿色三角代表冷水团特征站位,黑色矩形和蓝色圆形代表近岸站位
布在南黄海中部(图6(b)绿色三角站位);而第一、四象限诸点分布在长江口及江苏浅滩站位(图8(b)蓝色圆形站位);第三象限诸点分布在苏北沿岸以及山东半岛东南(图6(b)黑色矩形站位)。因此在南黄海划分出冷水团站位(绿色三角)和近岸站位(蓝色圆点和黑色矩形),旨在更加清晰地分析在不同环境特征下颗粒物氮元素的循环和转化过程。
4.2. PN和δ15NPN分布特征
颗粒氮及其同位素在海洋中的分布受多种因素共同控制。海洋颗粒氮的主要来源是陆源输入、初级生产和物理过程输运 [5] [44] [45],同时物源性质(陆源、海源、大气沉降等)和生化过程(矿化、同化吸收等)都会影响颗粒氮的含量及其同位素特征 [46] [47]。
通过与中国及世界河口和近海悬浮颗粒氮同位素及碳氮比比较可以看出(表1),本论文观测δ15NPN结果略高于该海域以往研究,而与国内外近海观测结果较为接近。C/N在国内外研究中变化范围都比较大,
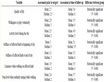
Table 1. Comparison of nitrogen isotope and carbon-nitrogen ratios of suspended particles in the South Yellow Sea with other oceans (average value in parentheses)
表1. 南黄海悬浮颗粒氮同位素和碳氮比与以往及国内外研究结果对比(括号内为平均值)
这与近海颗粒物来源及转化过程复杂有关,下面将根据颗粒氮空间分布特征结合环境因素对其分布差异影响因素进行探讨。
从颗粒物POC和PN含量关系(图7)看出,PN与POC有显著的相关关系(R2 = 0.98,p < 0.01),回归线在PN%有正截距(0.005),反映出颗粒物中包含无机氮 [48],其占颗粒物总氮15%,对颗粒氮影响较大,因此在后续分析中需要除去无机氮的影响。颗粒物碳氮比(C/N)为3.65~9.99 (6.20 ± 1.09, n = 143),略低于Redfield比值6.63 [49]。在其他大洋海域 [50] 以及东海 [51] 都观测到C/N偏离Redfield比值的现象,这可能与夏季微生物活动比较剧烈有关 [20]。
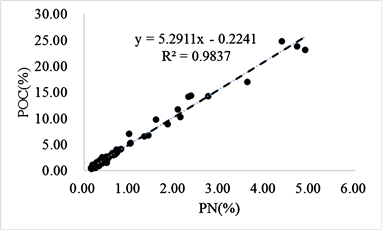
Figure 7. Relationship of POC% versus PN% of SPM in south Yellow Sea
图7. 南黄海颗粒物POC与PN百分比关系
从分布来看,表底层颗粒物都呈现出明显的空间差异(图4)。近岸海域表底层PN和POC都明显高于远岸站位,这与近岸陆源输入营养盐促进初级生产有关 [55]。近岸海域表层颗粒物δ13CPOC几乎都大于−23‰,判断颗粒物主要来源是原位初级生产 [51],则δ15NPN主要反映同化吸收氮源的氮同位素信号值。远岸海域(冷水团海域)颗粒有机碳δ13CPOC均低于−23‰,显示出陆源信号特征,向北逐渐偏负的趋势暗示了颗粒物从黄河输送而来的可能性 [56] [57]。而远岸海域δ15NPN相对近岸偏负,可能与颗粒氮来源(陆源输送、大气沉降和微生物等)有关。近岸海域底层颗粒物δ13CPOC同样近岸较高,反映出海源为主,但分布范围与数值均小于表层,这与长江冲淡水输送为主的陆源营养盐主要在海域上层,因此表层初级生产更高,分布范围更大有关。颗粒氮δ15NPN分布与表层相反,反而冷水团海域略高于近岸海域。特别是研究海域东北方向的中部海域由最高值。这可能与颗粒氮经历的转化过程有关。为进一步分析整个水柱颗粒物的空间变化,本文以颗粒物碳、氮含量及同位素对底深作图进行进一步分析(图8)。随站位深度增加颗粒物的性质有明显的变化趋势(图8)。POC、PN含量从浅水(近岸)到深水(冷水团)显著升高,显示出受陆源输入营养盐的影响 [55]。颗粒氮δ15NPN在浅水站位变化范围较小,可能由于再悬浮造成混合比较均匀。而在深水站位δ15NPN变化范围较大,结合图8(d)中PN百分比的分布变化看出,冷水团站位PN%含量相对更高,因此除来自陆源输入外,可能高氮含量、低δ15N的微生物也对颗粒氮有一定贡献 [17] [58],故而表层颗粒氮δ15NPN相对偏负。冷水团站位水深较深,整个水柱δ15NPN变化变化范围更大,表明冷水团海域水体中不同水层颗粒氮矿化程度有明显差异 [21]。
总之,近岸与冷水团海域颗粒氮及其同位素在空间分布上存在显著差异。这些差异可能是由于物质来源以及经历的过程不同造成,下面将通过近岸与冷水团对比探讨差异形成的原因。
4.3. PN和δ15NPN空间分布特征影响因素
文为了辨析南黄海水体PN和δ15NPN空间分布特征差异的影响因素,下面从环境特征差异、颗粒氮
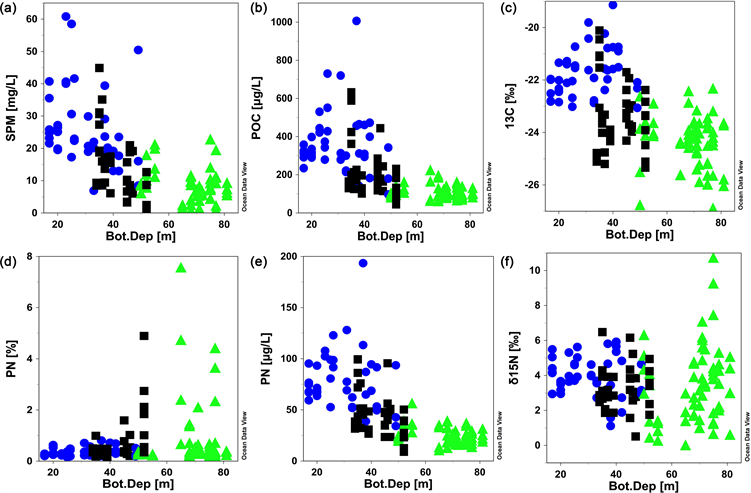
Figure 8. Variation of SPM concentration (a), POC (b), δ13CPOC (c)、PN% (d)、PN (e) and δ15NPN (f) with bottom depth (bottom depth abbreviates to Bot.Dep, cold water masses station with green, inshore station with blue and black)
图8. 调查站位水体SPM浓度(a)、POC (b)、δ13CPOC (c)、PN% (d)、PN (e)和δ15NPN (f) 随底深变化(Bot.Dep代表底深,绿色代表冷水团站位,蓝色和黑色代表近岸站位)
循环过程差异、和近岸和冷水团海域动力过程差异等方面展开分析和讨论。
近岸站位在垂向上硝酸盐浓度以及颗粒氮δ15NPN都没有明显变化(图9(a)和图9(c))。颗粒物δ15NPN分布范围较窄,为0.51‰~6.48‰ (3.69‰ ± 1.22‰, n = 70),也反映出垂向混合的强烈造成水体颗粒氮性质分布比较均匀。PN百分比含量基本低于1%,可能是由于陆源输入及再悬浮造成颗粒物中包含较多低有机质含量物质 [59]。δ15NPN与ln[PN%]关系(图9(e),R2 = 0.003,p > 0.50)不符合瑞利分馏模型,反映出降解过程信号不是很清晰 [6],表明矿化过程不是影响近岸颗粒氮的主要过程。由以上看出,水体及底边界动力过程一方面使得水体中颗粒物和硝酸盐等各项参数垂向分布比较一致,另一方面造成沉积物再悬浮扰乱了水体原位初级生产和矿化过程的信号。无法准确判断颗粒氮的转化过程。
在冷水团站位,随深度增加硝酸盐浓度和δ15NPN呈现明显升高的趋势(图9(b)和图9(d))。表层硝酸盐处于耗尽状态,表明表层初级生产旺盛,无机氮几乎完全消耗。δ15NPN分布范围为−0.04‰~4.19‰ (平均值1.98‰ ± 1.27‰,n = 14)。底层硝酸盐浓度在整个水层中最高,为1.81~13.66 μmol/L (9.50 ± 3.20 μmol/L,n = 14),δ15NPN分布范围较大,为1.80‰~7.40‰ (4.50‰ ±1.76‰, n = 11)。结合δ15NPN和PN百分含量随深度变化可以看出,随深度增加颗粒物逐渐降解,释放14N矿化形成硝酸盐,而颗粒物本身氮同位素趋向偏正 [13] [17]。从图9(f)观察到颗粒氮δ15NPN和ln[PN%]在一定程度上反映出瑞利分馏过程(R2 = 0.07, p < 0.05),表明矿化过程是冷水团海域颗粒氮循环的重要过程。然而PN含量并没有表现出随深度降低的趋势。模拟和观测结果表明,冷水团中的颗粒会随时间而逐渐向更深处下沉 [56],韦钦胜 [60] 和蔡德陵等 [61] 对南黄海悬浮体迁移和沉积物来源研究也表明近岸颗粒物向南黄海输送是南黄海颗粒物的重要来源,因
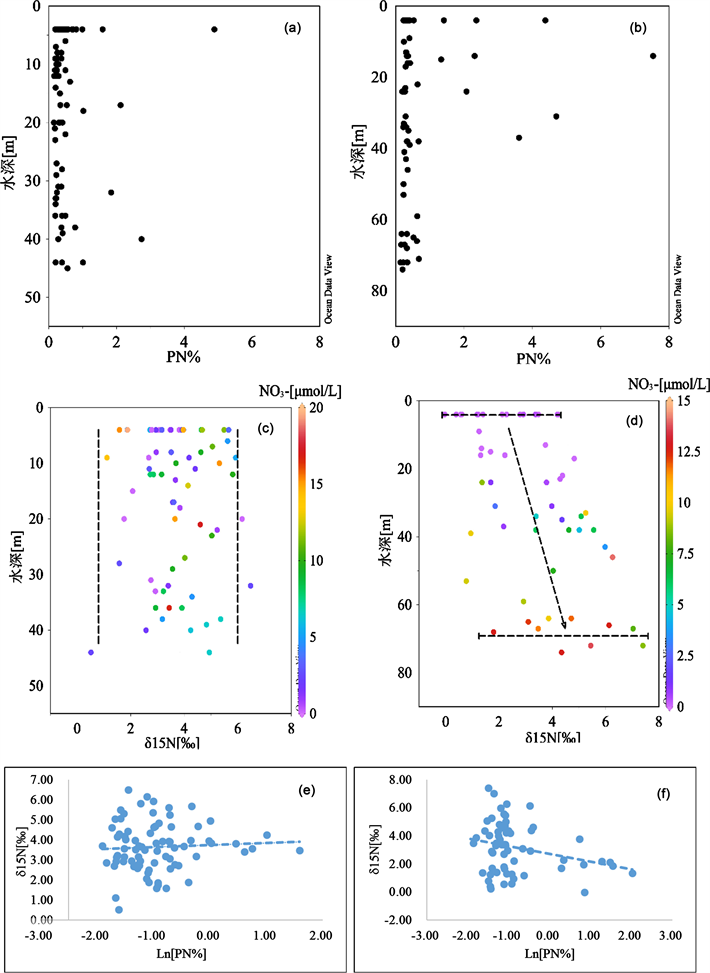
Figure 9. Variation of PN% and δ15NPN of particulate matter in inshore ((a), (c)) and cold water masses stations ((b), (d)); relationship of δ15NP versus Ln[PN%] in inshore (e) and cold water masses stations (f)
图9. 近岸((a)、(b))和冷水团((d)、(e))站位颗粒氮PN百分比含量和随深度变化(颜色表示硝酸盐浓度);近岸(c)和冷水团(f)站位颗粒氮δ15NPN与Ln[PN%]关系
此推测冷水团底层PN百分比降低而PN含量没有明显降低是由于近岸以及上层水体的输入在底层累积形成。
综上,近岸海域水体垂向混合和底边界再悬浮过程造成颗粒氮混合均匀,PN和δ15NPN在水体中没有明显的变化趋势,其次颗粒氮矿化过程强烈,无法观察到来源等过程的信号,因此近岸海域颗粒氮δ15NPN是陆源、海源以及同化、矿化等多过程共同作用的结果。冷水团海域水体层化提供了比较稳定的沉降环境,颗粒氮在水体中转化过程在一定程度上符合瑞利分馏模型,可以观察到垂向上矿化的趋势。总之,水动力过程、矿化过程是造成近岸和冷水团水体颗粒氮含量及同位素分布特征差异的主要原因。
5. 结论
黄海是我国“蓝色粮仓”的重要组成部分,其生态系统结构和演化一直是海洋科学研究的焦点。颗粒氮作为重要的生源要素之一,其在黄海的源、汇和转化过程是一个非常有研究意义的科学问题。本文通过采集和测定南黄海颗粒物碳、氮含量及同位素,结合环境因子分析,得出以下主要结论。
1) 夏季南黄海中部海域形成较为稳定的冷水团结构。南黄海悬浮颗粒氮及其同位素从近岸到外海空间分布差异显著。颗粒氮呈现从近岸到外海逐渐降低的分布趋势,δ15NPN在近岸水体垂向变化较小,在黄海中部(冷水团)区域垂向变化较大。
2) 通过结合环境因子分析,对南黄海颗粒物受控因素进行探讨发现:南黄海近岸水体颗粒氮空间分布主要受陆源输入及动力过程影响,近岸初级生产力较高但PN%含量较低以及δ15NPN在水体垂向差异较小的分布特征是同化吸收、再悬浮和矿化过程共同作用的结果;在黄海冷水团区域,冷水团层化形成的稳定水体结构是造成颗粒氮δ15NPN垂向升高分布特征的先决因素。
总之,南黄海悬浮颗粒物总氮和同位素分布呈现出显著的空间差异,这种差异是同化吸收、水体动力过程和矿化等过程共同作用的结果。
致谢
感谢国家自然科学基金委2016夏季黄渤海共享航次和“东方红二号”科考船提供的采样机会,感谢船上全体船员在采样过程提供的帮助。
基金项目
国家自然科学基金面上项目(41576082);青岛海洋科学与技术国家实验室“鳌山人才”计划项目(2015ASTP-OS08)。
文章引用
晏茂军,董书航,钟晓松,宁晓燕,辛 宇. 南黄海水体悬浮颗粒氮同位素特征
Nitrogen Isotope Characteristics of Suspended Particles in the South Yellow Sea[J]. 海洋科学前沿, 2019, 06(02): 19-33. https://doi.org/10.12677/AMS.2019.62003
参考文献
- 1. Wu, Y., Zhang, J., Li, D.J., et al. (2003) Isotope Variability of Particulate Organic Matter at the PN Section in the East China Sea. Biogeochemistry, 65, 31-49. https://doi.org/10.1023/A:1026044324643
- 2. 宋飞, 宋秀贤, 俞志明. 长江口海域表层水体颗粒有机物 δ15N的分布特征[J]. 海洋与湖沼, 2007, 38(6): 521-528.
- 3. Liénart, C., Susperregui, N., Rouaud, V., et al. (2016) Dynamics of Particulate Organic Matter in a Coastal System Characterized by the Occurrence of Marine Mucilage—A Stable Isotope Study. Journal of Sea Research, 116, 12-22. https://doi.org/10.1016/j.seares.2016.08.001
- 4. Lin, F., Chen, M., Tong, J., et al. (2014) Carbon and Nitrogen Isotopic Com-position of Particulate Organic Matter and Its Biogeochemical Implication in the Bering Sea. Acta Oceanologica Sinica, 33, 40-47. https://doi.org/10.1007/s13131-014-0570-y
- 5. Fan, H., Wang, X., Zhang, H., et al. (2018) Spatial and Temporal Variations of Particulate Organic Carbon in the Yellow-Bohai Sea over 2002-2016. Scientific Reports, 8, Article No. 7971. https://doi.org/10.1038/s41598-018-26373-w
- 6. Wang, H., Wang, A., Bi, N., et al. (2014) Seasonal Distribution of Suspended Sediment in the Bohai Sea, China. Continental Shelf Research, 90, 17-32. https://doi.org/10.1016/j.csr.2014.03.006
- 7. Falkowski, P.G. (1997) Evolution of the Nitrogen Cycle and Its Influence on the Biological Sequestration of CO2 in the Ocean. Nature, 387, 272-275. https://doi.org/10.1038/387272a0
- 8. Qiao, L., Huang, L., Wang, Z., et al. (2016) Flux and Its Seasonal Variation of Suspended Particulate Matter in the Bohai Sea, Yellow Sea and East China Sea. Geological Journal, 51, 22-34. https://doi.org/10.1002/gj.2803
- 9. Holmes, M., Eichner, C., Struck, U., et al. (1999) Reconstruction of Surface Ocean Nitrate Utilization Using Stable Nitrogen Isotopes in Sinking Particles and Sediments. In: Fischer, G. and Wefer, G., Eds., Use of Proxies in Paleoceanography, Springer, Berlin, 447-468. https://doi.org/10.1007/978-3-642-58646-0_18
- 10. Gawade, L., Krishna, M., Sarma, V., et al. (2018) Spatio-Temporal Variability in the Sources of Particulate Organic Carbon and Nitrogen in a Tropical Godavari Estuary. Estuarine, Coastal and Shelf Science, 215, 20-29. https://doi.org/10.1016/j.ecss.2018.10.004
- 11. 韦钦胜王, 葛人峰, 王保栋. 南黄海悬浮体的垂直分布特性及其指示意义[J]. 地球科学进展, 2013, 28(3): 374-390.
- 12. Sigman, D.M. and Casciotti, K.L. (2001) Nitrogen Isotopes in the Ocean. 1884-1894. https://doi.org/10.1006/rwos.2001.0172
- 13. Capone, D.G., Bronk, D.A., Mulholland, M.R., et al. (2008) Nitrogen in the Marine Environment. Academic Press, Cambridge.
- 14. Altabet, M.A., Deuser, W.G., Honjo, S., et al. (1991) Seasonal and Depth-Related Changes in the Source of Sinking Particles in the North Atlantic. Nature, 354, 136-139. https://doi.org/10.1038/354136a0
- 15. Montoya, J.P. (1994) Nitrogen Isotope Fractionation in the Modern Ocean: Implications for the Sedimentary Record. Springer, Berlin Heidelberg, 259-279. https://doi.org/10.1007/978-3-642-78737-9_11
- 16. 蔡德陵, 石学法, 周卫健, 等. 南黄海悬浮体和沉积物的物质来源和运移:来自碳稳定同位素组成的证据[J]. 科学通报, 2001(s1): 18-25.
- 17. Sigman, D., Karsh, K. and Casciotti, K. (2009) Ocean Process Tracers: Nitrogen Isotopes in the Ocean. Elsevier, Amsterdam. https://doi.org/10.1016/B978-012374473-9.00632-9
- 18. Gruber, N. (2008) Chapter 1—The Marine Nitrogen Cycle: Overview and Challenges. In: Nitrogen in the Marine Environment, Elsevier, Amsterdam, 1-50. https://doi.org/10.1016/B978-0-12-372522-6.00001-3
- 19. Montoya, J.P., Carpenter, E.J. and Capone, D.G. (2002) Nitrogen Fixation and Nitrogen Isotope Abundances in Zooplankton of the Oligotrophic North Atlantic. Limnology and Oceanography, 47, 1617-1628. https://doi.org/10.4319/lo.2002.47.6.1617
- 20. Wu, Y., Dittmar, T., Ludwichowski, K.-U., et al. (2007) Tracing Suspended Organic Nitrogen from the Yangtze River Catchment into the East China Sea. Marine Chemistry, 107, 367-377. https://doi.org/10.1016/j.marchem.2007.01.022
- 21. Waser, N., Harrison, P., Nielsen, B., et al. (1998) Nitrogen Isotope Frac-tionation during the Uptake and Assimilation of Nitrate, Nitrite, Ammonium, and Urea by a Marine Diatom. Limnology and Ocea-nography, 43, 215-224. https://doi.org/10.4319/lo.1998.43.2.0215
- 22. Lourey, M.J., Trull, T.W. and Sigman, D.M. (2003) Sensitivity of δ15N of Nitrate, Surface Suspended and Deep Sinking Particulate Nitrogen to Seasonal Nitrate Depletion in the Southern Ocean. Global Biogeochemical Cycles, 17, G1081. https://doi.org/10.1029/2002GB001973
- 23. Saino, T. and Hattori, A. (1980) 15N Natural Abundance in Oceanic Suspended Particulate Matter. Nature, 283, 752-754. https://doi.org/10.1038/283752a0
- 24. Altabet, M.A. (1988) Variations in Nitrogen Isotopic Composition between Sinking and Suspended Particles: Implications for Nitrogen Cycling and Particle Transformation in the Open Ocean. Deep Sea Research Part A. Oceanographic Research Papers, 35, 535-554. https://doi.org/10.1016/0198-0149(88)90130-6
- 25. Altabet, M.A. and Francois, R. (1994) Sedimentary Nitrogen Isotopic Ratio as a Recorder for Surface Ocean Nitrate Utilization. Global Biogeochemical Cycles, 8, 103-116. https://doi.org/10.1029/93GB03396
- 26. Blackburn, T.H. (1997) Release of Nitrogen Compounds Following Resuspension of Sediment: Model Predictions. Journal of Marine Systems, 11, 343-352. https://doi.org/10.1016/S0924-7963(96)00129-7
- 27. Middelburg, J.J. and Nieuwenhuize, J. (1998) Carbon and Nitrogen Stable Isotopes in Suspended Matter and Sediments from the Schelde Estuary. Marine Chemistry, 60, 217-225. https://doi.org/10.1016/S0304-4203(97)00104-7
- 28. Lehmann, M.F., Bernasconi, S.M., Barbieri, A., et al. (2002) Preservation of Organic Matter and Alteration of Its Carbon and Nitrogen Isotope Composition during Simulated and in Situ Early Sedimentary Diagenesis. Geochimica et Cosmochimica Acta, 66, 3573-3584. https://doi.org/10.1016/S0016-7037(02)00968-7
- 29. Mariotti, A., Lancelot, C. and Billen, G. (1984) Natural Isotopic Composition of Nitrogen as a Tracer of Origin for Suspended Organic Matter in the Scheldt Estuary. Geochimica et Cosmochimica Acta, 48, 549-555. https://doi.org/10.1016/0016-7037(84)90283-7
- 30. 刘秀娟, 俞志明, 宋秀贤, 等. 长江口海域悬浮颗粒有机物的稳定氮同位素分布及其生物地球化学意义[J]. 海洋科学, 2010, 34(1): 11-17.
- 31. Liu, Q., Kandasamy, S., Lin, B., et al. (2017) Biogeo-chemical Characteristics of Suspended Particulates at Deep Chlorophyll Maximum Layers in the East China Sea. Biogeosciences Discussions, 1-38.
- 32. Robinson, R.S., Kienast, M., Luiza Albuquerque, A., et al. (2012) A Review of Nitrogen Isotopic Alteration in Marine Sediments. Paleoceanography, 27, PA4203. https://doi.org/10.1029/2012PA002321
- 33. 苏纪兰. 中国近海水文[M]. 北京: 海洋出版社, 2005.
- 34. Naimie, C.E., Blain, C.A. and Lynch, D.R. (2001) Seasonal Mean Circulation in the Yellow Sea—A Model-Generated Climatology. Continental Shelf Research, 21, 667-695. https://doi.org/10.1016/S0278-4343(00)00102-3
- 35. Xu, L.-L., Wu, D.-X., Lin, X.-P., et al. (2009) The Study of the Yellow Sea Warm Current and Its Seasonal Variability. Journal of Hydrodynamics, Ser. B, 21, 159-165. https://doi.org/10.1016/S1001-6058(08)60133-X
- 36. Wei, Q., Yao, Q., Wang, B., et al. (2015) Long-Term Variation of Nu-trients in the Southern Yellow Sea. Continental Shelf Research, 111, 184-196. https://doi.org/10.1016/j.csr.2015.08.003
- 37. Li, H., Zhang, Y., Tang, H., et al. (2017) Spatiotemporal Variations of Inorganic Nutrients along the Jiangsu Coast, China, and the Oc-currence of Macroalgal Blooms (Green Tides) in the Southern Yellow Sea. Harmful Algae, 63, 164-172. https://doi.org/10.1016/j.hal.2017.02.006
- 38. Shi, W. and Wang, M. (2009) Green Macroalgae Blooms in the Yellow Sea during the Spring and Summer of 2008. Journal of Geophysical Research, 114, C12010. https://doi.org/10.1029/2009JC005513
- 39. Niu, L., Van Gelder, P.H., Zhang, C., et al. (2016) Physical Control of Phytop-lankton Bloom Development in the Coastal Waters of Jiangsu (China). Ecological Modelling, 321, 75-83. https://doi.org/10.1016/j.ecolmodel.2015.10.008
- 40. 王保栋, 战闰. 长江口及其邻近海域营养盐的分布特征和输送途径[J]. 海洋学报, 2002, 24(1): 53-58.
- 41. Jin, J., Liu, S.M., Ren, J.L., et al. (2013) Nutrient Dynamics and Coupling with Phytoplankton Species Composition during the Spring Blooms in the Yellow Sea. Deep Sea Research Part II: Topical Studies in Oceanography, 97, 16-32. https://doi.org/10.1016/j.dsr2.2013.05.002
- 42. Park, Y., Choi, J. and Gao, S. (2001) Spatial Variation of Suspended Particulate Matter in the Yellow Sea. Geo-Marine Letters, 20, 196-200. https://doi.org/10.1007/s003670000055
- 43. 杨作升, 郭志刚, 王兆祥, 等. 黄东海陆架悬浮体向其东部深海区输送的宏观格局[J]. 海洋学报, 1992, 14(2): 81-90.
- 44. Hu, L., Shi, X., Guo, Z., et al. (2013) Sources, Dispersal and Preservation of Sedimentary Organic Matter in the Yellow Sea: The Importance of Depositional Hydrodynamic Forcing. Marine Geology, 335, 52-63. https://doi.org/10.1016/j.margeo.2012.10.008
- 45. 刁明亚. 夏季南黄海海域颗粒有机物和浮游生物的碳、氮稳定同位素分析[D]: [硕士学位论文]. 青岛: 中国海洋大学, 2015.
- 46. Chen, C.-T.A. (2009) Chemical and Physical Fronts in the Bohai, Yellow and East China Seas. Journal of Marine Systems, 78, 394-410. https://doi.org/10.1016/j.jmarsys.2008.11.016
- 47. Holmes, R.M., Aminot, A., Kérouel, R., et al. (1999) A Simple and Precise Method for Measuring Ammonium in Marine and Freshwater Ecosystems. Canadian Journal of Fisheries and Aquatic Sciences, 56, 1801-1808. https://doi.org/10.1139/f99-128
- 48. Liu, S.M., Li, L.W. and Zhang, Z. (2011) Inventory of Nutrients in the Bohai. Continental Shelf Research, 31, 1790-1797. https://doi.org/10.1016/j.csr.2011.08.004
- 49. Harris, D., Horwáth, W.R. and Van Kessel, C. (2001) Acid Fumigation of Soils to Remove Carbonates Prior to Total Organic Carbon or Carbon-13 Isotopic Analysis. Soil Science Society of America Journal, 65, 1853-1856. https://doi.org/10.2136/sssaj2001.1853
- 50. 张海波, 杨鲁宁, 王丽莎, 等. 2013年夏季黄、渤海颗粒有机碳分布及来源分析[J]. 海洋学报, 2016, 38(8): 24-35.
- 51. Zhang, S.W., Wang, Q.Y., Lü, Y., et al. (2008) Observation of the Seasonal Evolution of the Yellow Sea Cold Water Mass in 1996-1998. Continental Shelf Research, 28, 442-457. https://doi.org/10.1016/j.csr.2007.10.002
- 52. Ang, L., Fei, Y., et al. (2015) Interannual Variability of Temperature of the Northern Yellow Sea Cold Water Mass. Acta Oceanologica Sinica, 37, 30-42. (In Chinese)
- 53. 李昂. 黄海冷水团年际变化研究[D]: [博士学位论文]. 北京: 中国科学院研究生院(海洋研究所), 2016.
- 54. Pei, Y., Liu, X. and He, H. (2017) Interpreting the Sea Surface Temperature Warming Trend in the Yellow Sea and East China Sea. Science China Earth Sciences, 60, 1558-1568. https://doi.org/10.1007/s11430-017-9054-5
- 55. Gao, L., Li, D. and Ishizaka, J. (2014) Stable Isotope Ratios of Carbon and Nitrogen in Suspended Organic Matter: Seasonal and Spatial Dynamics along the Changjiang (Yangtze River) Transport Pathway. Journal of Geophysical Research: Biogeosciences, 119, 1717-1737. https://doi.org/10.1002/2013JG002487
- 56. Huang, C., Yao, L., Yang, H., et al. (2018) Variation Pattern of Particulate Organic Carbon and Nitrogen in Oceans and Inland Waters. Biogeosciences Discussions, 15, 1827-1841. https://doi.org/10.5194/bg-2017-68
- 57. Meisel, S., Struck, U. and Emeis, K.C. (2011) Nutrient Dynamics and Oceanographic Features in the Central Namibian Upwelling Region as Reflected in δ15N-Signals of Suspended Matter and Surface Sediments. Fossil Record, 14, 153-169. https://doi.org/10.5194/fr-14-153-2011
- 58. Möbius, J. (2013) Isotope Fractionation during Nitrogen Remineralization (Ammonification, Implications for Nitrogen Isotope Biogeochemistry. Geochimica et Cosmochimica Acta, 105, 422-432. https://doi.org/10.1016/j.gca.2012.11.048
- 59. Hu, L., Guo, Z., Feng, J., et al. (2009) Distributions and Sources of Bulk Organic Matter and Aliphatic Hydrocarbons in Surface Sediments of the Bohai Sea, China. Marine Chemistry, 113, 197-211. https://doi.org/10.1016/j.marchem.2009.02.001
- 60. Redfield, A.C. (1958) The Biological Control of Chemical Factors in the Environment. American Scientist, 46, 205-221.
- 61. Martiny, A.C., Vrugt, J.A., Primeau, F.W., et al. (2013) Regional Variation in the Particulate Organic Carbon to Nitrogen Ratio in the Surface Ocean. Global Biogeochemical Cycles, 27, 723-731. https://doi.org/10.1002/gbc.20061
NOTES
*通讯作者。