Advances in Clinical Medicine
Vol.
13
No.
10
(
2023
), Article ID:
73214
,
7
pages
10.12677/ACM.2023.13102137
活产数量与乳腺癌因果关系: 双样本孟德尔随机化
邵馨影,赵红*
延安大学附属医院肿瘤科一病区,陕西 延安
收稿日期:2023年8月26日;录用日期:2023年9月19日;发布日期:2023年9月27日

摘要
目的:本研究旨在应用双样本孟德尔随机化分析研究欧洲人群中活产数量与乳腺癌发病率之间的因果关系。方法:在开放GWAS网站中获得暴露因素GWAS ID,筛选与暴露相关的SNP且去除连锁不平衡,将去除与混杂因素及结局相关的SNPs作为工具变量。提取结局中与工具变量相关的SNPs并去除回文序列。进行双样本孟德尔随机化,得到初步结果。检测异质性及离群值,剔除离群的SNPs。计算beta值和标准误(SE),并将beta值转换成OR值,并计算beta和OR的95%置信区间。结果:双样本孟德尔随机化分析得到数据活产数量(OR: 0.778, 95%CI: 0.655~0.925, P = 0.005)。结论:活产数量与乳腺癌存在因果关系,并且存在负向因果,即活产数量越多乳腺癌发病率越低。
关键词
活产数量,乳腺癌,双样本孟德尔随机化,工具变量

Causal Relationship between Number of Live Births and Breast Cancer: Two Sample Mendelian Randomisation Analysis
Xinying Shao, Hong Zhao*
Oncology Division 1 Ward, Affiliated Hospital of Yan’an University, Yan’an Shaanxi
Received: Aug. 26th, 2023; accepted: Sep. 19th, 2023; published: Sep. 27th, 2023

ABSTRACT
Objective: The aim of this study was to investigate the causal relationship between the number of live births and the incidence of breast cancer in a European population using two-sample Mendelian randomization analysis. Methods: The exposure factor GWAS ID was obtained from the open GWAS website, the SNPs associated with exposure were screened and the linkage disequilibrium was removed, and the SNPs associated with confounders and outcomes were removed as instrumental variables. The SNPs associated with instrumental variables in the outcome were extracted and the palindromic sequence was removed. Two-sample Mendelian randomization was performed to obtain preliminary results. Heterogeneity and outlier values were detected, and outlier SNPs were eliminated. Compute beta values and standard errors (SE), and convert beta values to OR values, and compute 95% confidence intervals for beta and OR. Results: The number of live births was obtained by two-sample Mendelian randomization (OR: 0.778, 95%CI: 0.655~0.925, P = 0.005). Conclusion: There is a causal relationship between the number of live births and breast cancer, and there is a negative causal relationship, that is, the higher the number of live births, the lower the incidence of breast cancer.
Keywords:Number of Live Births, Breast Cancer, Two-Sample Mendelian Randomization, Instrumental Variable

Copyright © 2023 by author(s) and Hans Publishers Inc.
This work is licensed under the Creative Commons Attribution International License (CC BY 4.0).
http://creativecommons.org/licenses/by/4.0/


1. 引言
根据国内外2022年研究数据统计,癌症是全球死亡的主要原因,预计2023年癌症仍是全球死亡的主要原因,世界卫生组织报告全球每年约有125万人死于癌症。2023年1月美国癌症协会(American Cancer Society, ACS)在世界上发行量最大的肿瘤学期刊《临床医师癌症杂志》(CA: A Cancer Journal for Clinicians)上发表了2023年美国癌症统计数据。数据报告显示,2023年全美全年预计新发癌症病例数为1,958,310例,女性乳腺导管原位癌55,720例;2023美国将有609,820人死于癌症,其中女性致死率前三位的癌症为肺癌、乳腺癌和结直肠癌 [1] 。对于女性来说乳腺依旧拥有高致死率,且发病率出现年轻化,中国大城市乳腺癌平均发病年龄依旧在45岁左右,较欧美发达国家年轻10岁左右,35岁以下乳腺癌人群占8%左右,研究其发病机制对于预防和早期干预乳腺癌显得至关重要。2018年全球女性乳腺癌发病率和死亡率分别为46.3/105和13.0/105,且均呈现逐年上升趋势 [2] 。GLOBOCA-N2018年数据显示,除日本外发达国家乳腺癌发病率大于80.0/105,而大多数发展中国家乳腺癌发病率则低于40.0/105。虽然中国女性中乳腺癌发病率(36.1/105)和死亡率(8.8/105)低于世界发病率及死亡率水平,但由于人口基数大,中国女性乳腺癌发病人数及死亡人数均居世界首位,分别占世界女性乳腺癌发病和死亡人数的17.6%和15.6% [3] [4] 。近年来,女性乳腺癌的发病率逐年上升,患病年龄趋于年轻化,已成为全球重点公共卫生问题。本文旨在探讨高发病率高致死率的欧洲人群内乳腺癌的危险因素,为乳腺癌的预防和早诊早治提供依据。
目前关于活产数量与乳腺癌的因果关系探究均来源于观察性研究,而观察性研究方法学存在缺陷,即混杂因素和反向因果导致的偏倚;因此,观察性研究对于推断因果关系存在局限性。而孟德尔随机化(Mendelian Randomization, MR)作为一种流行病学研究中评估病因推断的数据分析技巧,它在非实验数据中,使用遗传变异作为工具变量(Instrumental Variable, IV)来估计感兴趣的暴露因素与所关注结局之间的因果关系,而疾病的发展是多基因及多因素共同作用形成的结果,孟德尔随机化可通过筛查工具变量控制其他混杂因素对于结果的影响。
2. 数据与方法
2.1. 数据来源
暴露与结局首先应满足孟德尔随机化模型的三大假设,即关联性假设 [5] 、独立性假设 [6] 、排他性假设 [7] ,其中关联性假设是指遗传变异与暴露有关,独立性假设是指该遗传变异与暴露和结果关联的任何混杂因素均不相关,排他性假设是指该遗传变异只能通过暴露影响结局,不能直接影响结局。本研究中暴露与结局数据来均自于IEU OpenGWAS project在线数据库,包括活产数量(GWAS: ukb-b-1209)与乳腺癌(GWAS ID: ieu-a-1130),具体数据详见表1。纳入本研究的数据均已在原始研究中获得伦理审查及知情同意。
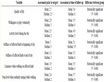
Table 1. Basic information on exposure and outcome data
表1. 暴露与结局数据基本信息
2.2. 工具变量
本研究中分析均选择全基因组显著性阈值P = 5 × 10⁻⁸下的相应暴露相关的单核苷酸多态性(single nucleotide polymorphism, SNP),从数据库中提取活产数量和乳腺癌的GWAS ID。首先提取与暴露相关的SNP,得到59个SNPs,设置R2 = 0.001,kb = 10,000去除连锁不平衡去除存在连锁不平衡的SNPs。并通
过 计算每个工具变量(Instrumental Variable, IV)的F值,排除F值 < 10的弱工
具变量 [8] ,通过https://www.phenoscanner.medschl.cam.ac.uk/网站逐一审查是否存在与混杂因素或结局有关的SNPs,最终得到59个SNPs作为工具变量。
2.3. 研究方法
本研究暴露与结局因果关系利用R4.2.2软件中的TwoSampleMR进行数据分析,其中包括三种回归模型,分别为MR-Egger [9] 、加权中值方法(Weighted Median, VME) [10] 、逆方差加权法(Inverse Variance Weighted, IVW) [11] ,使用IVW回归模型得到的pval值作为主要分析来估计潜在因果效应,当pval值 < 0.05则证明暴露与结局之间存在因果关系,并根据b值正负判断暴露与结局之间存在正向或逆向因果关系。为验证结果可靠性还需进行敏感性分析,包括异质性检测(Heterogeneity Test)、水平多效性检测(Horizontal Pleiotropy Test)和留一分析(Leave-one-out sensitivity Test);利用Cochran’s Q检验评估数据异质性,当pval > 0.05时使用固定效应模式IVW,当pval < 0.05,则使用随机效应模式IVW [12] ,可利用剔除离群SNPs调整异质性。水平多效性检测中认为当pval < 0.05时,与暴露相关IV效应为0仍存在其他因素导致结局发生,违反孟德尔三大假设。留一分析为逐个剔除SNP,并用IVW法计算剩余的SNPs的效应量,剔除对结局影响大的SNP使得结论具有可靠性。
3. 结果
3.1. 双样本孟德尔随机化分析结果
确定工具变量后,逐个计算F值,得到F值均>10,不存在弱工具变量,在结局中提取于IV相关的SNP,并进行同方向纠正去除存在会问序列的SNPS,得到与结局相关的SNPs 53个,进行MR分析并进行抑制性检测,得到pval = 0.007 < 0.05,存在异制性,检测离群值,剔除出5个离群SNPs,重新进行MR分析及敏感性分析,具体数据详见表2。
Table 2. Exposure and outcome two sample Mendelian Randomisation Analysis (correction of profit group value)
表2. 暴露与结局双样本孟德尔随机化(矫正离群值)
3.2. 敏感性分析
3.2.1. 异质性检验
使用Cochran Q检验利用IVW和MR-Egger进行异质性检测,计算出pval ≤ 0.05,检测离群值,剔除离群的5个SNPs,重新进行异质性检测,pval = 0.653 > 0.05不存在异制性,结果稳定,数据详见表3。
Table 3. After correction of profit group value heterogeneity detectio
表3. 剔除离群值前后异质性检验结果
3.2.2. 水平多效性检测
利用mr_pleiotropy_test函数得出pval = 0.128 > 0.05,无统计学意义,即不存在水平多效性,表明无其他混杂因素影响结果 [13] 。本研究中活产数量与乳腺癌之间的因果关系不受混杂因素影响,结果较为稳定。
3.2.3. 留一分析
逐一剔除计算剩余SNPs的meta效应(见图1),如图所示并无强影响的SNP位点,同样表示结果稳定。

Figure 1. Leave-one-out sensitivity analysis results
图1. Leave-one-out敏感性分析结果
3.3. 结果可视化
3.3.1. 散点图结果可视化
散点图可视化详见图2,图中每点代表着一个SNP位点,横坐标是SNP对暴露的效应,纵坐标是SNP对结局的效应,向下直线表示MR拟合结果。如图随着活产数量的升高,乳腺癌的发病风险下降。

Figure 2. Visualization of scatter chart results
图2. 散点图结果可视化
3.3.2. 森林图结果可视化
森林图可视化结果详见图3,水平实线反映的是单个SNP利用Wald ratio方法估计出来的结果,实线在0左侧表明这个SNP增加使得乳腺癌发病率降低,反之在0右侧表明SNP增加使得乳腺癌发病率增高,单个SNP结果并不存在意义,综合结果后红线表示IVW方法下活产数量的升高会降低乳腺癌的发病风险。

Figure 3. Visualization results of forest plot
图3. 森林图可视化结果
4. 讨论
目前乳腺癌致病风险因素大致可包括家族/遗传风险因素和个人风险因素两类,其中仅有10%~15%可归因于遗传因素,对于大部分患者来说可能是多种风险因素共同影响 [14] ,包括遗传、激素、生殖、营养、环境等多方面。由于不同国家的人种差异、经济发展和生活方式的不同,风险因素可能存在的差异,但大致相同 [15] [16] 。本文中通过双样本孟德尔随机化的分析方法得出活产数量与乳腺癌发病率之间存在因果关联,且呈现负相关,即活产数量越多乳腺癌的发病率越低。
孟德尔随机化相较于其他观察性实验而言,更简单直观地消除存在的混杂因素,但此方法仍存在一定的局限性,可能存在实验对象自愿参与、实验条件不同等因素对结果产生一定的影响。
文章引用
邵馨影,赵 红. 活产数量与乳腺癌因果关系:双样本孟德尔随机化
Causal Relationship between Number of Live Births and Breast Cancer: Two Sample Mendelian Randomisation Analysis[J]. 临床医学进展, 2023, 13(10): 15274-15280. https://doi.org/10.12677/ACM.2023.13102137
参考文献
- 1. Siegel, R.L., Miller, K.D., Wagle, N.S., et al. (2023) Cancer Statistics, 2023. CA: A Cancer Journal for Clinicians, 73, 17-48. https://doi.org/10.3322/caac.21763
- 2. Bray, F., Ferlay, J., Soerjomataram, I., et al. (2018) Global Cancer Statistics 2018: GLOBOCAN Estimates of Incidence and Mortality Worldwide for 36 Cancers in 185 Countries. CA: A Cancer Journal for Clinicians, 68, 394-424. https://doi.org/10.3322/caac.21492
- 3. World Health Organization (2020) Global Cancer Observatory (GCO): Cancer Today. http://gco.iarc.fr/today/home
- 4. Chen, W.Q., Zheng, R.S., Baade, P.D., et al. (2016) Cancer Statistics in China, 2015. CA: A Cancer Journal for Clinicians, 66, 115-132. https://doi.org/10.3322/caac.21338
- 5. Burgess, S., Thompson, S.G. and CRP CHD Genetics Collaboration (2011) Avoiding Bias from Weak Instruments in Mendelian Randomization Studies. International Journal of Epidemi-ology, 40, 755-764. https://doi.org/10.1093/ije/dyr036
- 6. Lawlor, D.A., Harbord, R.M., Sterne, J.A.C., et al. (2008) Mendelian Ran-domization: Using Genes as Instruments for Making Causal Inferences in Epidemiology. Statistics in Medicine, 27, 1133-1163. https://doi.org/10.1002/sim.3034
- 7. Hackinger, S. and Zeggini, E. (2017) Statistical Methods to De-tect Pleiotropy in Human Complex Traits. Open Biology, 7, Article ID: 170125. https://doi.org/10.1098/rsob.170125
- 8. Baum, C.F., Schaffer, M.E. and Stillman, S. (2007) Enhanced Routines for Instrumental Variables/Generalized Method of Moments Estimation and Testing. The Stata Journal, 7, 465-506. https://doi.org/10.1177/1536867X0800700402
- 9. Bowden, J., Del Greco, F.M., Minelli, C., et al. (2016) As-sessing the Suitability of Summary Data for Two-Sample Mendelian Randomization Analyses Using MR-Egger Regres-sion: The Role of the i-2 Statistic. International Journal of Epidemiology, 45, 1961-1974. https://doi.org/10.1093/ije/dyw220
- 10. Bowden, J., Smith, G.D., Haycock, P.C., et al. (2016) Consistent Estima-tion in Mendelian Randomization with Some Invalid Instruments Using a Weighted Median Estimator. Genetic Epidemi-ology, 40, 304-314. https://doi.org/10.1002/gepi.21965
- 11. Burgess, S., Dudbridge, F. and Thompson, S.G. (2016) Combining In-formation on Multiple Instrumental Variables in Mendelian Randomization: Comparison of Allele Score and Summarized Data Methods. Statistics in Medicine, 35, 1880-1906. https://doi.org/10.1002/sim.6835
- 12. Burgess, S. and Thompson, S.G. (2017) Interpreting Findings from Mendelian Randomization Using the MR-Egger Method. European Journal of Epidemiology, 32, 377-389. https://doi.org/10.1007/s10654-017-0255-x
- 13. Carter, A.R., Sanderson, E., Hammerton, G., et al. (2021) Mendelian Randomisation for Mediation Analysis: Current Methods and Challenges for Implementation. European Journal of Epidemiology, 36, 465-478. https://doi.org/10.1007/s10654-021-00757-1
- 14. Jenkins, S., Betancourt, A.M., Wang, J., et al. (2012) Endo-crineactive Chemicals in Mammary Cancer Causation and Prevention. The Journal of Steroid Biochemistry and Molecu-lar Biology, 129, 191-200. https://doi.org/10.1016/j.jsbmb.2011.06.003
- 15. Pathak, D.R. and Whittemore, A.S. (1992) Combined Effects of Body Size, Parity, and Menstrual Events on Breast Cancer Incidence in Seven Countries. American Journal of Epidemi-ology, 135, 153-168. https://doi.org/10.1093/oxfordjournals.aje.a116268
- 16. Pike, M.C., Kolonel, L.N., Henderson, B.E., et al. (2002) Breast Cancer in a Multiethnic Cohort in Hawaii and Los Angeles: Risk Factor-Adjusted Incidence in Japanese Equals and in Hawaiians Exceeds That in Whites. Cancer Epidemiology, Biomarkers & Prevention, 11, 795-800.
NOTES
*通讯作者。