Medical Diagnosis
Vol.
13
No.
01
(
2023
), Article ID:
62497
,
8
pages
10.12677/MD.2023.131011
合成MRI对前列腺癌分级的诊断价值
江芳莲,黄龙龙,徐文娟,杜芳
扬州大学附属医院放射科,江苏 扬州
收稿日期:2023年2月3日;录用日期:2023年3月8日;发布日期:2023年3月15日

摘要
目的:研究合成MRI定量参数对前列腺癌(PCa)分级的诊断价值。方法:回顾性地分析了2020~2022年扬州大学附属医院112例经病理大切片诊断为前列腺癌(PCa)的患者。所有患者术前进行前列腺MRI检查,扫描序列包括DWI和合成MRI。根据ISUP (国际泌尿外科病理学会)分级将病灶分为低危组(ISUP ≤ 2)和高危组(ISUP ≥ 3)。对照大病理切片最大层面,在DWI和合成MRI上分别勾画ROI,得到并记录ADC值、T1值、T2值、PD值。采用独立样本t检验或Mann Whitney U检验分析比较两组数据之间的差异,并应用受试者工作特征(ROC)曲线评估不同参数对前列腺癌侵袭性的诊断效能,同时采用DeLonng检验比较曲线下的面积(AUC),运用Spearman相关分析评估各定量参数与ISUP分级的相关性。结果:高危组PCa的T1值、T2值及ADC值均低于低危组[1144 (1040, 1308.75) ms比1223.5 (1124.0, 1402.0) ms;(70.91 ± 7.9) ms比(81.27 ± 8.6) ms;(519.59 ± 100.59) ms比(728.36 ± 120.13) ms],(均P < 0.05)。在鉴别高危组与低危组前列腺癌上,T1、T2值的AUC均低于ADC值,两两之间差异均P值 < 0.05。另外T1值、T2值及ADC值与ISUP分级均呈负相关(r = −2.03、−0.521、−0.682,均P < 0.05)。结论:合成MRI定量参数可以区分高危PCa和低危PCa,并与ISUP分级呈负相关,有助于术前无创鉴别PCa的侵袭性。
关键词
前列腺癌,磁共振成像,扩散加权成像,合成MRI

Diagnostic Value of Synthetic MRI for Prostate Cancer Grade
Fanglian Jiang, Longlong Huang, Wenjuan Xu, Fang Du
Department of Radiology, Affiliated Hospital of Yangzhou University, Yangzhou Jiangsu
Received: Feb. 3rd, 2023; accepted: Mar. 8th, 2023; published: Mar. 15th, 2023

ABSTRACT
Objective: To investigate the diagnostic value of synthetic MRI quantitative parameters for prostate cancer (PCa) grading. Methods: A retrospective analysis was performed for 112 patients diagnosed with prostate cancer by pathological large sections in the Affiliated Hospital of Yangzhou University from 2020 to 2022. All patients had a preoperative MRI of the prostate with scan sequences including DWI and synthetic MRI. Lesions were classified according to the ISUP (International Society of Urological Pathology) classification into low-risk group (ISUP ≤ 2) and high-risk group (ISUP ≥ 3). According to the maximum level of large pathological sections, the ADC value, T1 value, T2 value, PD value, R1 value and R2 value can be obtained by delineating the ROI on DWI and synthetic MRI, and the ADC value, T1 value, T2 value and PD value can be recorded. Independent sample t-test or Mann Whitney U test analysis was used to compare the differences between the two groups of data, and the receiver operating characteristic (ROC) curve was used to evaluate the diagnostic efficacy of different parameters on prostate cancer aggressiveness, and the area under the DeLonng test comparison curve (AUC) was used to evaluate the correlation between each quantitative parameter and ISUP grade. Results: The T1 value, T2 value and ADC value of PCa in the high-risk group were lower than those in the low-risk group [1144 (1040, 1308.75) ms ratio was 1223.5 (1124.0, 1402.0) ms; (70.91 ± 7.9) MS ratio (81.27 ± 8.6) ms; (519.59 ± 100.59) ms ratio (728.36 ± 120.13) ms], (all P < 0.01). In the identification of prostate cancer in the high-risk group and the low-risk group, the AUC of T1 and T2 values was lower than that of ADC, and the difference between the two was < 0.05. In addition, T1 value, T2 value and ADC value were negatively correlated with ISUP classification (r = −2.03, −0.521, −0.682, all P < 0.05). Conclusion: The quantitative parameters of synthetic MRI can distinguish between high-risk PCa and low-risk PCa, and are negatively correlated with ISUP grade, which is helpful to identify the aggressiveness of PCa non-invasively before surgery.
Keywords:Prostate Cancer, Magnetic Resonance, Diffusion Weighted Imaging, Synthetic MRI

Copyright © 2023 by author(s) and Hans Publishers Inc.
This work is licensed under the Creative Commons Attribution International License (CC BY 4.0).
http://creativecommons.org/licenses/by/4.0/


1. 引言
前列腺癌(prostate cancer, PCa)是男性中第二常见的恶性肿瘤,是全球死亡率最高的五种癌症之一 [1] [2] 。大约九分之一的男性在其一生中将被诊断出患有PCa [3] 。格里森组织学评分(Gleason评分)是PCa结局的有力预测指标,在治疗方式的选择中起着重要作用 [4] [5] 。放射肿瘤学家依靠可获得的临床信息(活检Gleason评分和前列腺特异性抗原[PSA])来确定每个前列腺癌患者的最佳治疗方案 [6] 。但由于穿刺活检样本数量有限且因取样局限存在抽样误差,常导致术前穿刺与根治术后的Gleason评分经常不一致 [7] 。因此,需要一种可靠的非侵入性和准确的方法术前明确Gleason评分。合成MRI是一种二维多动态多回波(multi dynamic multi echo, MDME)序列,一次扫描同时获得T1、T2和质子密度(proton density, PD)、R1、R2等5个定量参数,且可重建对比加权图像 [8] 。该技术已成功应用于全身多个部位 [9] ,其中包括前列腺,但大多数已发表的文献主要是研究前列腺癌与前列腺良性病变的鉴别,特别是PZ [10] 。本研究以病理大切片为金标准,研究合成 MRI定量参数对前列腺癌分级的诊断价值。相较于传统病理切片,病理大切片通过对整个前列腺切面分层取材,保留了前列腺切面的完整性,关于肿瘤的大小、位置分布及多灶性分布能提供更多信息,有助于与术前影像学进行对照 [11] 。
2. 资料与方法
2.1. 一般资料
本研究通过了扬州大学附属医院伦理委员会批准(批准号:2022-YKL06-28-003)。回顾性连续收集研究分析2020年10月~2022年9月接受了前列腺癌根治术并制有病理大切片的患者。纳入标准:① 所有患者均接受了根治性前列腺癌切除术,制成病理大切片;② 术后病理为前列腺腺泡腺癌。排除标准:① 术前前列腺MRI扫描,扫描序列不包括MAGIC序列或图像质量不合格;② MRI检查前接受过激素或放射治疗;③ 主要病灶最大径 ≤ 5 mm。最终本研究纳入112例前列腺癌患者,共158个病灶。
2.2. MRI扫描方法
使用美国GE SIGNA Pioneer 3.0 T MR扫描仪和32通道心脏相控阵线圈进行成像。扫描序列包括:1) 横断面T1WI,TR 624 ms,TE 16.6 ms,FOV 20 cm × 20 cm,矩阵260 × 260,层厚3 mm,层间距0.5 mm,激励次数1.75,回波链长度5,加速因子2,扫描时间1 min 35 s。2) 横断面T2WI,TR 3515 ms,TE 92.1 ms,FOV 20 cm × 20 cm,矩阵288 × 288,层厚3 mm,层间距0.5 mm,激励次数2,回波链长度29,加速因子2,扫描时间2 min 14 s。3) 横断面DWI,TR 2663 ms,TE:87 ms,FOV 18 cm × 18 cm,矩阵90 × 46,层厚3 mm,层间距0.5 mm,激励次数12,加速因子2,b值50、2000 s/mm2,扫描时间4 min 10 s。(4) 合成MRI,采用MDME序列,TR 4200 ms,TE 16、92 ms,延迟时间170、670、1840、3840 ms,FOV 20 cm × 20 cm,矩阵260 × 200,层厚3 mm,层间距0.5 mm,激励次数1,回波链长度16,加速因子2,扫描时间4 min 12 s。
2.3. 病理组织学与影像学对照
本研究所有前列腺癌病灶根据2014年国际泌尿病理协会Gleason分级系统进行评分 [12] 。根据病理结果,依据ISUP(国际泌尿外科病理学会)分级将病灶分为低危组(ISUP ≤ 2)和高危组(ISUP ≥ 3) [13] ,参照前列腺癌病灶、尿道、射精管等解剖结构,由两名放射科医师和1名病理科医师将MRI图像和前列腺病理大标本进行匹配。对于多发病灶选择长径大于5 mm,病理切片上可见的病灶进行分析。使用SyMRI 8.0软件对MDME原始数据进行后处理,生成T1、T2和PD定量参数图,基于DWI图像自动生成ADC图。由2名放射科医师对照病理大切片在T2WI上选择病变最大层面手动勾画ROI,尽可能包括病变组织,将ROI复制到定量参数图,获得病变的T1值、T2值、PD值和ADC值。
2.4. 统计学分析
统计学使用SPSS 27.0 和Medcalc软件。首先使用 Kolmogorov Smirnov检验评估计量资料的正态性和方差齐性。符合正态分布的数据用 表示,不符合的用M (Q1, Q3)表示。采用独立样本t检验或Mann Whitney U检验。绘制ROC曲线评估各参数区分不同级别前列腺癌的诊断效能,采用DeLong方法比较曲线下面积(area under the curve, AUC)的差异。使用最大化Youden指数值的最佳截止点作为计算诊断敏感性,特异性,阳性预测值(PPV)和阴性预测值(NPV)的标准。用Spearman相关分析评估各参数与Gleason评分相关性。双侧检验,检验标准α = 0.05。
3. 结果
患者血清前列腺特异性抗原(prostate specific antigen, PSA)为0.98~1000 (62.26 ± 164.03) ng/ml。病理结果显示前列腺癌病灶158个,其中Gleason 3 + 3病灶12个、3 + 4病灶44个、4 + 3病灶54个、3 + 5病灶4个、4 + 4病灶4个、5 + 3病灶2个、4 + 5病灶26个、5 + 4病灶12个。低危组56个病灶,高危组102个病灶。
3.1. 低危组与高危组前列腺癌病灶定量参数比较
高危组PCa的T1值、T2值及ADC值均低于低危组[1144 (1040, 1308.75) ms比1223.5 (1124.0, 1402.0) ms;(70.91 ± 7.9) ms比(81.27 ± 8.6) ms;(519.59 ± 100.59) ms比(728.36 ± 120.13) ms],(Z = −2.579、−6.526、−8.380,均P < 0.01,表1,图1);两组间PD值差异没有统计学意义(P > 0.05),表1。
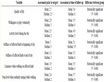
Table 1. Comparison of quantitative parameters and ADC values of synthetic MRI for different grades of prostate cancer
表1. 不同级别前列腺癌合成MRI定量参数和ADC值比较

Figure 1. (a)~(f) Pathology and MRI images of prostate cancer patients. The patient is 63 years old. (a) shows a large pathological section, with prostate cancer lesions located on the left side of the transitional zone (green circle). (b) shows the cross-sectional T2WI, and the prostate cancer lesion is low intense. (c) shows DWI, and the lesions are significantly hyperintense. (d)~(f) synthesized MRIT1, T2 and proton density maps, respectively, and the parameters of prostate cancer lesions were lower than those of normal prostate tissue
图1. (a)~(f) 前列腺癌患者病理和MRI图像。患者63岁。(a)为病理大切片,前列腺癌病灶位于移行带偏左侧(绿色圈)。(b)为横断面T2WI,前列腺癌病灶为低信号。(c)为DWI,病灶呈明显高信号。(d)~(f)分别为合成MRIT1、T2和质子密度图,前列腺癌病灶个参数都低于正常前列腺组织
3.2. 定量参数对低危组、高危组前列腺癌的诊断效能
各参数鉴别高危组与低危组前列腺癌的ROC曲线结果见图2。各参数对PCa侵袭性诊断效能的比较见表2。对于鉴别高危组前列腺癌与低危组前列腺癌,ADC值的诊断效能高于T2值、T1值,结果显示:T2值与ADC值的诊断效能相当[AUC:0.814 (0.745~0.871)比0.904 (0.847~0.945);Z = 2.049,P = 0.036];T1值与ADC值的诊断效能相当[AUC:0.624 (0.544~0.700)比0.904 (0.847~0.945);Z = 5.670,P < 0.0001];T2值与T1值的诊断效能相当[AUC:0.814 (0.745~0.871) 0.624比(0.544~0.700);Z = 3.893,P = 0.0001]。

Figure 2. ROC curve of quantitative parameters of MRI to predict PCa aggressiveness
图2. MRI定量参数预测PCa侵袭性的ROC曲线
Table 2. Comparison of the diagnostic efficacy of PCa aggressiveness with different quantitative parameters
表2. 不同定量参数对PCa侵袭性诊断效能的比较
4. 讨论
本研究以病理大切片为标准,探讨了合成MRI定量参数评估前列腺癌侵袭性的应用价值。结果表明,与高危组相比,低危组的T1值、T2值、ADC值均显著降低,表明合成MRI定量参数对前列腺癌分级具有应用价值。同时得到T1值、T2值及ADC值与ISUP分级呈负相关。
这与既往的一些研究相符,既往有研究表明,MR在Pca分级中发挥着重要作用,特别是结合定量参数和定性参数 [14] ,有研究表明在前列腺癌分级方面,定量T2值与疾病的侵袭性相关 [15] [16] [17] 。另有Meyer等人的一项包含26项研究的大型荟萃分析再次证实ADC值与Gleason评分相关 [18] 。既往的研究更注重如何鉴别PCa与前列腺良性病变,有研究表明与良性组织相比,PZ和TZ的T2值均显著降低,然而在PCA分级方面却没有表现出明显的相关性 [19] 。同样地,Mai等人发现低定量T2值与较高的PCa侵袭性相关 [20] 。然而,这些结果显示PCa的T2定量值与ISUP分级之间没有显著相关性。更有研究表明PCa的定量T2值与ISUP分级、ADC值无显著相关性 [19] 。这与我们的研究有所出入,可能是由于样本量较小且样本来源不同。
合成MRI的T2定量值与组织T2弛豫时间相关,这补充了通过T2WI成像获得的解剖学和空间信息。它将T2WI自旋回波序列的信号衰减曲线和T2弛豫时间使用参数彩图来表示 [21] 。它可以根据不同成分的前列腺组织中的基质或组织的水隔室和比例提供功能信息,以及解剖学和空间信息 [22] 。目前T2值和ADC值作为反应水含量、细胞密度和组织组成的生物标志物 [23] 。Gleason分级系统主要基于组织结构,与以上标志物并无直接相关 [12] ,但这可以用来解释关于T2值、ADC值与Gleason评分之间相关性的各种可能 [16] [24] 。
T1值是组织的纵向弛豫时间,反映胶原、蛋白、水、脂肪等多种组织成分的含量 [25] ,它可以作为一种快速、定量和非侵入性的技术来确定生物组织特性 [26] 。目前主要用于心血管疾病研究,已被确立为表征心肌组织的重要工具,包括淀粉样变性的定量和炎症性肌病的检测 [27] [28] 。既往有研究显示T1值有助于鉴别前列腺癌与间质增生结节、腺体增生结节和前列腺炎,且总体诊断效能与T2值无明显差异 [25] ,但对于鉴别前列腺癌侵袭性并无价值 [15] 。这与本研究的结果,高危组前列腺癌较低危组T1值显著降低有所出入。
PD值是组织的固有磁特性,主要反映组织中的水含量 [29] 。有研究发现前列腺癌PD值低于腺体增生结节和前列腺炎,但与间质增生结节无显著差异,提示PD值在诊断前列腺癌中存在一定限度 [25] 。目前关于PD值对前列腺癌的侵袭性的诊断的研究较少。我们的结果表明PD值对鉴别前列腺癌的侵袭性没有显著价值。
本研究优势在于,运用了一种称为合成MRI的新型定量技术,该技术可在一次扫描中获得T1,T2和PD的定量图以及常规的对比度加权图像。它比需要额外序列的标准T1或T2映射技术更加实用,因为后者不可避免地会延长扫描时间。目前首要的问题是要保证合成MRI的准确性和可重复性,以用于进一步广泛的临床应用,这需要进一步的研究。
本研究的局限性:1) 本研究是单中心研究,且入组患者都行前列腺癌根治术治疗,缺少采取放疗及其他治疗方式的患者入组,有一定选择偏倚;2) 本研究病理参考为前列腺大切片,尽管相对于穿刺活检,是目前最为准确的病理诊断方法,但受限于技术本身,无法完全避免病理–影像匹配中的误差。
综上,合成MRI定量参数对诊断前列腺癌侵袭性具有一定应用价值,对术前无创明确前列腺癌分级具有一定的临床应用价值。
文章引用
江芳莲,黄龙龙,徐文娟,杜 芳. 合成MRI对前列腺癌分级的诊断价值
Diagnostic Value of Synthetic MRI for Prostate Cancer Grade[J]. 医学诊断, 2023, 13(01): 56-63. https://doi.org/10.12677/MD.2023.131011
参考文献
- 1. Bray, F., Ferlay, J., Soerjomataram, I., et al. (2018) Global Cancer Statistics 2018: GLOBOCAN Estimates of Incidence and Mortality Worldwide for 36 Cancers in 185 Countries. CA: A Cancer Journal for Clinicians, 68, 394-424. https://doi.org/10.3322/caac.21492
- 2. Pernar, C.H., Ebot, E.M., Wilson, K.M., et al. (2018) The Epidemiology of Pros-tate Cancer. Cold Spring Harbor Perspectives in Medicine, 8, a030361. https://doi.org/10.1101/cshperspect.a030361
- 3. Lee, H.H., Shaw, N.M., Mohammed, S., et al. (2020) Prostate Cancer in Men with Treated Advanced Heart Failure: Should We Keep Screening? Urology, 136, 46-50. https://doi.org/10.1016/j.urology.2019.11.022
- 4. Milonas, D., Venclovas, Z., Gudinaviciene, I., et al. (2019) Impact of the 2014 International Society of Urological Pathology Grading System on Concept of High-Risk Prostate Cancer: Comparison of Long-Term Oncological Outcomes in Patients Undergoing Radical Prostatectomy. Frontiers in Oncology, 9, 1272. https://doi.org/10.3389/fonc.2019.01272
- 5. Walsh, P.C., Deweese, T.L. and Eisenberger, M.A. (2007) Localized Pros-tate Cancer. New England Journal of Medicine, 357, 2696-2705. https://doi.org/10.1056/NEJMcp0706784
- 6. Caster, J.M., Falchook, A.D., Hendrix, L.H., et al. (2015) Risk of Pathologic Upgrading or Locally Advanced Disease in Early Prostate Cancer Patients Based on Biopsy Gleason Score and PSA: A Population-Based Study of Modern Patients. International Jour-nal of Radiation Oncology, Biology, Physics, 92, 244-251. https://doi.org/10.1016/j.ijrobp.2015.01.051
- 7. Zhang, G.-M.-Y., Han, Y.-Q., Wei, J.-W., et al. (2020) Radiomics Based on MRI as a Biomarker to Guide Therapy by Predicting Upgrading of Prostate Cancer from Biopsy to Radical Prostatec-tomy. Journal of Magnetic Resonance Imaging, 52, 1239-1248. https://doi.org/10.1002/jmri.27138
- 8. Warnties, J.B.M., Leinhard, O.D., West, J., et al. (2008) Rapid Magnetic Resonance Quantification on the Brain: Optimization for Clinical Usage. Magnetic Resonance in Medicine, 60, 320-329. https://doi.org/10.1002/mrm.21635
- 9. 陈爽, 欧阳汉. 集成MRI在临床诊断中的应用价值[J]. 磁共振成像, 2020, 11(9): 833-836.
- 10. Lee, C.H. (2019) Quantitative T2-Mapping Using MRI for Detection of Prostate Malignancy: A Systematic Review of the Literature. Acta Radiologica, 60, 1181-1189. https://doi.org/10.1177/0284185118820058
- 11. 杨珺, 周学科, 郑爱华, 等. 前列腺癌根治切除标本大切片的制片技术[J]. 中华病理学杂志, 2015, 44(6): 408-409.
- 12. Epstein, J.I., Egevad, L., Amin, M.B., et al. (2016) The 2014 Interna-tional Society of Urological Pathology (ISUP) Consensus Conference on Gleason Grading of Prostatic Carcinoma Definition of Grading Patterns and Proposal for a New Grading System. American Journal of Surgical Pathology, 40, 244-252. https://doi.org/10.1097/PAS.0000000000000530
- 13. Epstein, J.I., Zelefsky, M.J., Sjoberg, D.D., et al. (2016) A Con-temporary Prostate Cancer Grading System: A Validated Alternative to the Gleason Score. European Urology, 69, 428-435. https://doi.org/10.1016/j.eururo.2015.06.046
- 14. Hoang, D.A., Melodelima, C., Souchon, R., et al. (2016) Quantitative Analysis of Prostate Multiparametric MR Images for Detection of Aggressive Prostate Cancer in the Peripheral Zone: A Multi-ple Imager Study. Radiology, 280, 117-127. https://doi.org/10.1148/radiol.2016151406
- 15. Cui, Y., Han, S., Liu, M., et al. (2020) Diagnosis and Grading of Prostate Cancer by Relaxation Maps from Synthetic MRI. Journal of Magnetic Resonance Imaging, 52, 552-564. https://doi.org/10.1002/jmri.27075
- 16. Mai, J., Abubrig, M., Lehmann, T., et al. (2019) T2 Mapping in Prostate Cancer. Investigative Radiology, 54, 146-152. https://doi.org/10.1097/RLI.0000000000000520
- 17. 宋娜, 王涛, 张丹, 等. 集成MRI弛豫时间定量技术在前列腺癌诊断及侵袭性评估中的价值[J]. 中华医学杂志, 2022, 102(15): 1093-1099.
- 18. Meyer, H.-J., Wienke, A. and Surov, A. (2020) Discrimination between Clinical Significant and Insignificant Prostate Cancer with Apparent Diffusion Coefficient—A Systematic Review and Meta-Analysis. BMC Cancer, 20, Article No. 482. https://doi.org/10.1186/s12885-020-06942-x
- 19. Klingebiel, M., Schimmoeller, L., Weiland, E., et al. (2022) Value of T-2 Mapping MRI for Prostate Cancer Detection and Classification. Journal of Magnetic Resonance Imaging, 56, 413-422. https://doi.org/10.1002/jmri.28061
- 20. Walker, S.M., Fernandez, M. and Turkbey, B. (2020) Advances in Prostate Mag-netic Resonance Imaging. Magnetic Resonance Imaging Clinics, 28, 407. https://doi.org/10.1016/j.mric.2020.03.006
- 21. Noeth, U., Shrestha, M., Schuere, J.-R., et al. (2017) Quantitative in Vivo T2 Mapping Using Fast Spin Echo Techniques—A Linear Correction Procedure. Neuroimage, 157, 476-485. https://doi.org/10.1016/j.neuroimage.2017.06.017
- 22. Nguyen, K., Sarkar, A. and Jain, A.K. (2014) Prostate Cancer Grading: Use of Graph Cut and Spatial Arrangement of Nuclei. IEEE Transactions on Medical Imaging, 33, 2254-2270. https://doi.org/10.1109/TMI.2014.2336883
- 23. Chatterjee, A., Watson, G., Myint, E., et al. (2015) Changes in Epitheli-um, Stroma, and Lumen Space Correlate More Strongly with Gleason Pattern and Are Stronger Predictors of Prostate ADC Changes than Cellularity Metrics. Radiology, 277, 751-762. https://doi.org/10.1148/radiol.2015142414
- 24. Surov, A., Meyer, H.J. and Wienke, A. (2020) Correlations between Apparent Diffusion Coefficient and Gleason Score in Prostate Cancer: A Systematic Review. European Urology Oncology, 3, 489-497. https://doi.org/10.1016/j.euo.2018.12.006
- 25. 崔亚东, 李春媚, 韩思圆, 等. 合成MRI定量参数对前列腺癌的诊断价值[J]. 中华放射学杂志, 2021, 55(9): 975-980.
- 26. Child, N., Suna, G., Dabir, D., et al. (2018) Comparison of MOLLI, shMOLLLI, and SASHA in Discrimination between Health and Disease and Relationship with Histologically Derived Collagen Volume Fraction. European Heart Journal—Cardiovascular Imaging, 19, 768-776. https://doi.org/10.1093/ehjci/jex309
- 27. Fontana, M., Banypersad, S.M., Treibel, T.A., et al. (2014) Native T1 Mapping in Transthyretin Amyloidosis. JACC-Cardiovascular Imaging, 7, 157-165. https://doi.org/10.1016/j.jcmg.2013.10.008
- 28. Yu, L., Sun, J., Sun, J., et al. (2018) Early Detection of Myocardial In-volvement by T-1 Mapping of Cardiac MRI in Idiopathic Inflammatory Myopathy. Journal of Magnetic Resonance Imaging, 48, 415-422. https://doi.org/10.1002/jmri.25945
- 29. Gracien, R.-M., Reitz, S.C., Hof, S.M., et al. (2016) Changes and Variability of Proton Density and T1 Relaxation Times in Early Multiple Sclerosis: MRI Markers of Neuronal Damage in the Cerebral Cortex. European Radiology, 26, 2578-2586. https://doi.org/10.1007/s00330-015-4072-x