Open Journal of Natural Science
Vol.
11
No.
05
(
2023
), Article ID:
71977
,
13
pages
10.12677/OJNS.2023.115099
长江上游极端降水时空变化特征分析
阳春芳1,2
1成都信息工程大学大气科学学院,高原大气与环境四川省重点实验室,气候与环境变化联合实验室, 成都平原城市气象与环境四川省野外科学观测研究站,四川 成都
2红原县气象局,四川 阿坝藏族羌族自治州
收稿日期:2023年7月10日;录用日期:2023年8月30日;发布日期:2023年9月7日

摘要
本文采用中国气象科学数据共享服务网提供的1990~2020年长江流域地区687个气象站点逐日的降水数据,利用线性回归分析、Mann-Kendall趋势检验、滑动T检验、小波分析等,对1990~2020年的年和夏季极端降水进行时空变化特征分析,结果表明:1) 近31年年和夏季极端降水指数分布特征相似,持续干期(CDD)整体均表现出西北向东南递减趋势,降水强度(SDII)、强降水量(R95p)、湿日降水量(PRCPTOT)分布较为一致,整体均表现出西北向东南递增的趋势。年和夏季极端降水指数分布特征均表明青海沱沱河西部地区干旱形势较为严峻。2) 极端降水指数年变化趋势结果表明,长江上游地区连续降水事件的持续时间有所缩短,意味着长江上游地区的降水过程以持续时间较短的降水模式为主,31a长江上游北部地区极端降水增加趋势比南部地区更显著,夏季变化趋势图则发现东部地区极端降水增加趋势最为明显。3) 时间变化上,近31年长江上游地区年和夏季极端降水指数的线性趋势均表明PRCPTOT呈下降趋势,CDD、SDII均呈上升趋势,R95p在年和夏季上表现有所不同,夏季R95p呈下降趋势,年R95p则相反,且所有指数均通过0.1的显著性水平。4) 长江上游地区极端降水指数年显著性周期为2~4年,夏季显著性周期为2~3年。SDII和R95p在年和夏季中均存在突变年,年极端降水指数SDII突变主要发生在2012年和2014年,R95p突变主要发生在2012,夏季SDII突变主要发生在1996年,R95p主要发生在2015年。
关键词
极端降水,时空变化,变化趋势,长江上游

Analysis of Temporal and Spatial Variation Characteristic of Extreme Precipitation in the Upper Yangtze River
Chunfang Yang1,2
1Plateau Atmosphere and Environment Key Laboratory of Sichuan Province, Joint Laboratory of Climate and Environment Change, Chengdu Plain Urban Meteorology and Environment Observation and Research Station of Sichuan Province, Chengdu, China, College of Atmospheric Sciences, Chengdu University of Information Technology,Chengdu Sichuan
2Hongyuan County Meteorological Bureau, Aba Tibetan Autonomous Prefecture Sichuang
Received: Jul. 10th, 2023; accepted: Aug. 30th, 2023; published: Sep. 7th, 2023

ABSTRACT
To study the impact of extreme precipitation on the upper Yangtze River region, the day-by-day precipitation data from 687 meteorological stations in the Yangtze River basin area from 1990 to 2020 provided by the China Meteorological Science Data Sharing Service Network were used, and linear regression analysis, Mann-Kendall trend test, sliding t-test, and wavelet analysis were used to conduct the annual and summer extreme precipitation. The results show that 1) the distribution characteristics of annual and summer extreme precipitation indices are similar in the past 31 years, and the continuous dry period (CDD) shows an overall decreasing trend from northwest to southeast, and the distribution of precipitation intensity (SDII), intense precipitation (R95p), and wet daily precipitation (PRCPTOT) are more consistent, and the overall shows an increasing trend from northwest to southeast. Both the annual and summer extreme precipitation index distribution characteristics indicate a more severe drought situation in the western part of Qinghai Tuotuo River. 2) The results of the annual trend of extreme precipitation index show that the duration of continuous precipitation events in the upper reaches of the Yangtze River has been shortened, implying that the precipitation process in the upper reaches of the Yangtze River is dominated by precipitation patterns of shorter duration. 31a the increasing trend of extreme precipitation in the northern areas of the upper reaches of the Yangtze River is more significant than that in the southern areas, while the summer trend map finds the most obvious increasing trend of extreme precipitation in the eastern areas. 3) In terms of temporal changes, the linear trends of both annual and summer extreme precipitation indices in the upper Yangtze River region in the last 31 years show that PRCPTOT has a decreasing trend, CDD and SDII have an increasing trend, and R95p behaves differently on annual and summer, with summer R95p showing a decreasing trend and annual R95p the opposite, and all indices pass the significance level of 0.1. 4) The annual significance cycle of extreme precipitation indices in the upper Yangtze River is 2~4 years, and the summer significance cycle is 2~3 years. R95p occurred mainly in 2015.
Keywords:Extreme Precipitation, Spatial and Temporal Changes, Trends, Upper Yangtze River

Copyright © 2023 by author(s) and Hans Publishers Inc.
This work is licensed under the Creative Commons Attribution International License (CC BY 4.0).
http://creativecommons.org/licenses/by/4.0/


1. 引言
长江上游地区历来水资源丰富,是是保障社会经济可持续发展的重要水源地及水能资源开发的重点区域 [1] 。在全球变暖的大背景下,极端天气、气候事件的增多对农业、生态系统和人类社会生活造成巨大影响 [2] 。降水的时空变化对水文、生态和生物地球化学过程等都有重要影响,进而反作用于气候稳定性。例如,极端降水引发的洪涝和干旱,影响农作物生长;强降水引起的土壤侵蚀。长江上游地区作为中国重要的气候响应区之一,极端降水和洪涝灾害频发。因此,分析长江上游区域极端降水的时空变化特征,对气候变化,防灾减灾有重要意义。
近年来,国内外关于长江流域降水特征进行了大量研究。李林等利用1961~2016年共56a逐日降水资料发现中雨对长江流域的贡献最大、大雨次之、特大暴雨最小 [3] ;郭广芬利用1961~2017年长江流域700个气象站夏降水资料分析长江地区子流域极端降水的时空分布特征和空间降水配置关系,发现1980年至1990年长江上游以干旱频发为主,2000以来以大部分地区也以干旱频发为主,当夏季极端降水为多雨时,该地夏季降水空间差异较大 [4] ;还有学者发现青藏高原东部和长江中下游地区降水趋于湿润,其余地区降水趋于干燥 [5] 。目前,关于长江流域降水变化的研究主要集中于长江中下游地区,上游地区主要通过模式资料进行研究 [6] ,且模式资料对长江上游地区的模拟效果还有待提高,并且前人对长江上游地区的极端降水的空间分布以及极端降水的周期性和突变点的研究较少,长江上游地区在全球变暖的背景下,降水形势尚不明确,且长江上游地区夏季降水量占总降水量的70%~80%。本文运用时间尺度和空间尺度的分析方法,以长江上游地区为主,基于1990~2020年长江上游地区的逐日降水资料,研究长江上游地区31年年和特征季节夏季极端降水的时空变化规律,能直观了解长江上游地区极端降水的空间分布特点及时间变化趋势,对长江上游地区的防灾减灾有重要意义。
2. 资料与方法
2.1. 数据来源
本研究区长江上游地区介于90˚E~112˚E、36˚N~24˚N之间,长江上游地区包括青海、西藏、四川、云南、重庆和湖北等6个省市。采用中国气象科学数据共享服务网提供的1990~2020年长江流域地区687个气象站点逐日的降水数据,其气象站点具体分布如图1所示。所选站点符合基本标准,但观测期间仍有一些数据缺失,研究采用了张增信等人一种填补缺测的方法 [7] ,在可接受的范围预分析,在数据选择过程中选用的站点选取数据尽量完整,并对各站点数据进行一致性检验和质量控制。

Figure 1. Distribution of meteorological stations in the upper reaches of the Yangtze River
图1. 长江上游地区气象站点分布
2.2. 极端降水指数的定义
本研究采用气候变化检测和指数专家组(ETCCDI)推荐的极端降水指数,根据Guan yinghui论文中结果,发现持续干期(CDD)、降水强度(SDII)、强降水量(R95p)、湿日降水量(PRCPTOT)等四个指数适用于评估长江上游地区的极端降水的变化趋势 [5] ,各极端指数的定义及单位见表1。
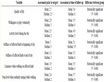
Table 1. Definition of the selected 4 extreme precipitation indices
表1. 所选4个极端降水指数的定义
3. 长江上游地区极端降水指数的时空变化特征分析
3.1. 时空变化特征
长江上游地区极端降水指数多年平均值的空间分布图如图2:从各极端降水指数的空间分布特征可以看出,SDII、R95p和PRCPTOT的空间分布趋势较为一致,在长江上游地区主要表现为西北向东南递增的趋势,与CDD基本呈相反的分布特征。青海沱沱河地区附近以及西藏八宿地区附近干旱形势最为严峻,其CDD表现为高值区,R95p、PRCPTOT和SDII表现为低值区,长江上游地区降水受地形因素影响,降水分布不均,与实际情况较为符合。

Figure 2. Spatial distribution map of four extreme precipitation indices in the upper reaches of the Yangtze River from 1990~2020
图2. 长江上游1990~2020年4个极端降水指数空间分布图
长江上游地区极端降水指数变化趋势的空间分布图如图3所示:从各极端降水指数变化趋势的空间分布图可以看出,近31年来长江上游地区极端降水变化趋势分布极为不均匀。长江上游北部地区的降水过程将以持续时间较短、强度较强的降水模式为主,四川平武地区附近体现极为明显,CDD、PRCPTOT、SDII、R95p均呈增加趋势。长江上游南部地区极端降水趋势也有所增加,尤其云南地区,CDD、SDII、R95p均呈增加趋势,PRCPROR呈减少趋势,但趋势较小。表明长江上游地区连续降水事件的持续时间有所缩短,也就是说,长江上游地区的降水过程以持续时间较短的降水模式为主,但31a长江上游北部地区极端降水增加趋势比南部地区更显著。

Figure 3. Spatial distribution of four extreme precipitation index trends in the upper reaches of the Yangtze River from 1990~2020
图3. 长江上游1990~2020年4个极端降水指数变化趋势的空间分布
根据长江上游各气象站1990~2020年各极端降水指数多年平均值,结合线性趋势对各极端气候指数进行趋势变化分析。根据各指标的线性趋势的时间序列(见图4),近31a间长江上游地区极端降水指数分布不平衡。持续干期(CDD)呈增加趋势,多年平均CDD值为31.0~44.0 d,其线性变化趋势为1.521 d/(10a);降水强度(SDII)呈上升趋势,多年平均SDII值为7.8~11.0 mm/d,其线性变化趋势为0.6928 mm/(d∙10a);强降水量(R95p)呈增加趋势,多年平均R95p值为28.0~43.0 mm,其线性变化趋势为2.625 mm/(10a);湿日降水量(PRCPTOT)呈减少趋势,多年平均PRCPTOT值为910~1160 mm,其线性变化趋势为−31.1478 mm/(10a)。其中,强降水量(R95p)上升趋势最为明显,湿日降水量(PRCPTOT)下降趋势最为显著,且四个指数均通过置信度为90%的显著性检验。CDD、SDII、PRCPTOT的最小值均为1997年,SDII和PRCPTOT的最大值均出现在2020年。

Figure 4. Time series of four extreme precipitation indices in the upper reaches of the Yangtze River from 1990~2020
图4. 长江上游1990~2020年4个极端降水指数的时间序列
3.2. 周期分析
对四个极端指数分别用Morlet小波函数进行小波分析。图5(a)为CDD小波能量谱,图5(b)为用红噪声对检验分析的结果图。CDD变化周期为2~6年和2~4年;SDII在2013~2020年有一个2~4年的周期;R95p的显著性周期为2~5年和2~4年;PRCPTOT的显著性周期为2~4年和4~5年、2~3年和6年。
3.3. 突变检验
结合M-K检验和T检验,如图6、图7所示,可以发现:SDII和R95p存在突变年,年SDII突变主要发生在2012年和2014年,R95p突变主要发生在2012见(表2)。
4. 长江上游地区夏季极端降水指数时空变化特征分布
4.1. 夏季时空变化特征
长江上游地区极端降水指数夏季多年平均值的空间分布图如图8所示,从夏季极端指数的空间分布特征可以看出,SDII和R95p空间分布较为一致,与CDD基本呈相反特征;夏季青海沱沱河和西藏八宿地区的干旱形势较年极端指数表现更为严峻,CDD表现为高值区,SDII和强降水量R95p以及PRCPTOT均表现为低值区。夏季极端降水指数在长江上游地区表现出长江上游东部地区较西部地区更容易发生洪涝灾害,其CDD基本为低值区,SDII、R95p、PRCPTOT均表现为高值区。

Figure 5. Wavelet analysis of four extreme precipitation indices in the upper reaches of the Yangtze River in 1990~2020
图5. 长江上游1990~2020年4个极端降水指数的小波分析

Figure 6. M-K mutation test of four extreme precipitation indices in the upper reaches of the Yangtze River from 1990~2020
图6. 长江上游1990~2020年4个极端降水指数的M-K突变检验

Figure 7. M-K mutation test of four extreme precipitation indices in the upper reaches of the Yangtze River from 1990~2020
图7. 长江上游1990~2020年4个极端降水指数的滑动T检验
Table 2. M-K test and sliding T test results of four extreme precipitation indices in the upper reaches of the Yangtze River from 1990~2020
表2. 长江上游1990~2020年4个极端降水指数的M-K检验与滑动T检验结果

Figure 8. Spatial distribution map of four extreme precipitation indices in the upper reaches of the Yangtze River in the summer of 1990~2020
图8. 长江上游1990~2020年夏季4个极端降水指数的空间分布图
长江上游夏季极端指数变化的空间趋势分布如由图9所示,各极端降水指数呈增加趋势,PRCPTOT在长江上游地区增加趋势最为明显,近31a长江上游地区夏季降水朝着降水增多的方向发展,CDD指数有微小的上升趋势,在西藏、青海等地的夏季SDII、R95p、PRCPTOT值呈显著上升趋势,PRCPTOT在整个长江上游地区基本呈显著上升趋势,31a夏季长江上游东部地区的极端降水增加趋势体现最为明显。

Figure 9. Spatial change trend map of four extreme precipitation indices in the upper reaches of the Yangtze River in the summer of 1990~2020
图9. 长江上游1990~2020年夏季4个极端降水指数空间变化趋势图
根据长江上游地区各气象站1990~2020年逐日降水量,求得各极端降水指数逐年夏季平均值,如图10所示,从各指标的线性趋势来看,近31a间长江上游地区夏季极端指数分布较为不均匀,波动较大,CDD值呈明显上升趋势,多年夏季平均CDD值为4.2~8.8 d,其线性趋势为0.844 d/(10a);SDII值也为上升趋势,多年夏季平均SDII值为10.2~16.0 mm/d,其线性趋势为0.905 mm/(d∙10a);R95p值呈减小趋势,多年夏季平均R95p值为35.4~41.6 mm,其线性趋势为~0.612 mm/(10a);PRCPTOT值呈减小趋势,多年夏季平均PRCPTOT值为130~225 mm,其线性趋势为−7.370 mm/(10a)。其中所有极端降水指数均通过置信度为90%的显著性检验。
4.2. 夏季周期分析
对夏季多年平均四个极端指数分别用Morlet小波函数进行小波分析,如图11所示;CDD的显著性周期为2~3年和3~4年;SDII在1994~1997年和2013~2020年对应着两个能量较弱的2~3年和2~4年周期;R95p的显著性周期为2~3年和2~5年;PRCPTOT的显著性年际变化周期为2~5年和2~3年。

Figure 10. The time series of four extreme precipitation indices in the upper reaches of the Yangtze River in the summer of 1990~2020
图10. 长江上游1990~2020年夏季4个极端降水指数的时间序列

Figure 11. Analysis of four extreme precipitation index wavelets in the upper reaches of the Yangtze River in the summer of 1990~2020
图11. 长江上游1990~2020年夏季4个极端降水指数小波分析图
4.3. 夏季突变检验
结合M-K检验和T检验,如图12、图13所示,可以发现:SDII和R95p在夏季中存在突变年,夏季SDII突变主要发生在2015年,R95p主要发生在1996年见(表3)。

Figure 12. M-K mutation test of four extreme precipitation indices in the upper reaches of the Yangtze River in the summer of 1990~2020, (a) summer CDD value mutation test
图12. 长江上游1990~2020年夏季4个极端降水指数的M-K突变检验

Figure 13. Sliding T test of four extreme precipitation indices in the upper reaches of the Yangtze River in the summer of 1990~2020
图13. 长江上游1990~2020年夏季4个极端降水指数的滑动T检验
Table 3. M-K test and sliding T test results of four extreme precipitation indices in the summer of 1990~2020 in the upper reaches of the Yangtze River
表3. 长江上游1990~2020年夏季4个极端降水指数的M-K检验和滑动T检验结果
5. 结论与展望
5.1. 结论
本文利用由中国区域多个站点插值得到的逐年逐日降水量格点资料计算了年极端降水指数和夏季极端降水指数,通过利用线性回归分析、Mann-Kendall趋势检验、滑动T检验、小波分析等,对31年来年和夏季的极端指数进行了时空变化分析,得出如下结论:
1) 长江上游地区极端降水指数在空间尺度上,年和夏季极端指数分布相似,CDD整体均表现出西北向东南递减趋势,SDII、R95p、PRCPTOT分布较为一致,整体均表现出西北向东南递增的趋势,高低值区分布明显,其与CDD基本呈相反的分布特征。综合来看,年和夏季分布图中,青海沱沱河西部地区干旱形势都较为严峻,SDII和PRCPTOT表现为低值区,CDD表现为高值区。
2) 长江上游地区连续降水事件的持续时间有所缩短,表明长江上游地区的降水过程以持续时间较短的降水模式为主,31a长江上游北部地区极端降水增加趋势比南部地区更显著,夏季变化趋势图则发现东部地区极端降水增加趋势最为明显。
3) 时间变化上,近31年来长江上游地区年和夏季极端降水指数线性趋势均表明PRCPTOT呈下降趋势,CDD、SDII呈上升趋势,但R95p在年和夏季上表现有所不同,夏季R95p呈下降趋势,年R95p则相反,且所有指数均通过0.1的显著性水平。
4) 长江上游地区极端降水指数年显著性周期为2~4年,夏季显著性周期为2~3年;SDII和R95p在年和夏季中都存在突变年,年极端降水指数SDII突变主要发生在2012年和2014年,R95p突变主要发生在2012,夏季SDII突变主要发生在1996年,R95p主要发生在2015年。
5.2. 讨论
结合前人对长江中下游地区和本文对长江上游地区得极端降水时空变化特征分析。可以发现:长江流域降水过程以短时的降水事件为主。西藏东部等地降水趋于湿润,长江上游大部分地区均趋于干燥,而前人研究发现长江中下游地区降水也呈干燥趋势发展;长江流域整体向西湿东干的降水趋势发展。由于本研究采用站点资料计算极端降水指数,但西藏、青海等地区站点分布较为稀疏,资料较少,插值后的结果有一定误差。本文选取并计算的极端降水指数较少,对长江上游地区极端降水的研究具有一定的局限性。
因此,为了弥补长江上游西部地区资料的缺失,未来可选取对长江流域适用性强、分辨率较高的的模式资料进行研究,并计算更多的极端指数来对长江上游地区进行综合性分析。
致谢
本论文的完成离不开我的老师赖欣老师、同学和朋友关心与帮助。感谢赖老师对我论文编写、排版等提出的宝贵意见,回想起整个论文写作过程,虽有不易,但也使我沉淀下来,收获颇多。
文章引用
阳春芳. 长江上游极端降水时空变化特征分析
Analysis of Temporal and Spatial Variation Characteristic of Extreme Precipitation in the Upper Yangtze River[J]. 自然科学, 2023, 11(05): 830-842. https://doi.org/10.12677/OJNS.2023.115099
参考文献
- 1. 李文广, 彭辉, 韩凯, 等. 考虑水库影响的长江上游流域降水时空变化分析[J]. 中国农村水利水电, 2019(10): 75-80.
- 2. 李海舰, 薛继亮. 气候变化影响中国粮食生产的区域差异分析[J]. 农业经济, 2013(8): 73-75.
- 3. 李林. 变化环境下中国不同强度降雨的时空变化特征[J]. 水电能源科学, 2021, 39(3): 8-11+23.
- 4. 郭广芬, 杜良敏, 肖莺, 高雅琦, 吴瑶. 长江流域夏季极端降水时空分布特征[J]. 干旱气象, 2021, 39(2): 235-243.
- 5. Guan, Y.H., et al. (2017) Trends and Variability of Daily Precipitation and Extremes during 1960-2012 in the Yangtze River Basin, China. International Journal of Climatology, 37, 1282-1298. https://doi.org/10.1002/joc.4776
- 6. 刘波, 翟建青, 高超, 等. 1960-2005年长江上游水文循环变化特征[J]. 河海大学学报(自然科学版), 2012, 40(1): 95-99.
- 7. Zhang, Z.X., Zhang, Q. and Jiang, T. (2007) Changing Features of Extreme Precipitation in the Yangtze River Basin during 1961-2002. Journal of Geographical Sciences, 17, 33-42. https://doi.org/10.1007/s11442-007-0033-x