International Journal of Ecology
Vol.
09
No.
02
(
2020
), Article ID:
35808
,
13
pages
10.12677/IJE.2020.92027
Environmental Effect Condition (Air Temperature) of Aerosols on Gross Primary Productivity of Vegetation
Muyuan Gao
College of Geography and Environmental Sciences, Zhejiang Normal University, Jinhua Zhejiang

Received: Apr. 27th, 2020; accepted: May 21st, 2020; published: May 28th, 2020

ABSTRACT
In this study, WRF Chem model is used to drive the reanalysis data of ECMWF,
Keywords:WRF-Chem, VPM, GPP, Haze

气溶胶的环境效应(气温)对植被总初级生产力的影响
高牧原
浙江师范大学,地理与环境科学学院,浙江 金华

收稿日期:2020年4月27日;录用日期:2020年5月21日;发布日期:2020年5月28日

摘 要
本研究利用WRF-Chem模式,以欧洲中期天气预报中心(ECMWF)的再分析数据作为驱动数据,中国多分辨率排放清单共享平台(MEIC)人为源排放数据作为人为源排放数据,以华北平原作为研究区,研究时间为2016年4月6日,设置一组对比试验,分别模拟有无人为源排放影响下的环境,将有无气溶胶环境的环境因素带入到植被光合作用模型(Vegetation Photosynthesis Model, VPM)模型中获得两者环境下的总初级生产力(Gross primary productivity, GPP)。本文主要研究结果是气溶胶导致研究区内大部分时段平均气温下降,小部分时段因吸热气溶胶原因导致平均气温,轻微上升。从区域尺度分析,气溶胶环境效应与气溶胶的关系,受下行辐射与气溶胶种类影响,导致气温不能随PM 2.5浓度同步变化,在一些区域出现气温升高的现象。白天平均气温均有所下降,下降范围0.350%~2.667%。其环境效应导致2016年4月6日整个研究区平均GPP下降0.03%~2.55%。从区域尺度分析,虽然气溶胶环境效应(气温)总体以降温为主,但存在区域性增温,导致部分地区GPP增加最高增加超过5%,但其地区本身GPP却小于1 g C m−2∙day−1,其变化绝对值却很小。GPP减少绝对值的地区位于山东省,江苏省,河南省,安徽省交界处减少为0.05 g C m−2∙day−1~0.2 g C m−2∙day−1,增加绝对值在苏北地区增加为0.05 g C m−2∙day−1~0.1 g C m−2∙day−1。
关键词 :WRF-Chem,VPM,GPP,雾霾

Copyright © 2020 by author(s) and Hans Publishers Inc.
This work is licensed under the Creative Commons Attribution International License (CC BY 4.0).
http://creativecommons.org/licenses/by/4.0/


1. 引言
大气气溶胶是液态或固态微粒在空气中的悬浮体系。它们能作为冰晶和水滴的凝结核、太阳辐射的吸收体和散射体,并参与各种化学循环,是大气的重要组成部分。大气气溶胶产生的天然或人为原因有:雾、霾、烟等 [1]。随着全球经济的飞速发展,人类活动不断向大气中排放大量的颗粒物,导致全球大气中的气溶胶含量大幅度上升,这种上升趋势在东亚和南亚尤其显著 [2] [3] [4]。气溶胶生态学效应的研究在近十年来才逐渐得到重视 [5] [6] [7] [8]。目前大气气溶胶的研究主要集中在对其成分来源、大气物理化学和对人类健康的影响上。大气气溶胶粒子能够吸收、散射太阳辐射,直接影响全球的辐射平衡 [9]。太阳辐射是陆地生态系统CO2吸收和水分蒸发的能量来源,太阳辐射的任何变化都可能显著地改变陆地生态系统生物地球化学循环过程。另外,当云结合中含有气溶胶粒子,气溶胶浓度的变化会影响云量、云的寿命及其光学特性,从而引起全球和区域内的温度及降水的变化 [10],进而影响陆地生态系统的关键生物地球化学等过程 [11] [12] [13] [14]。
大气气溶胶通过吸收和反射太阳辐射,从而影响地面–大气的辐射平衡,此现象属于气溶胶的直接效应(direct effect)。同时云的凝结核为气溶胶粒子,气溶胶浓度的变化会影响云量、云的寿命及云的光学特性,从而引起全球和区域内的温度及降水的变化 [9] [11] [15],这称之为气溶胶的间接效应(indirect effect)。人为气溶胶(BC、有机碳、 、 和dust)对总体环境的影响是起到降温作用,其中直接辐射导致辐射总量减少0.5 W∙m−2,而间接云反照率影响导致减少0.7 W∙m−2 [16] [17]。吸光性气溶胶,如BC,能使大气层增温。而光散射粒子,如 、 和有机物可以对地表起冷却作用。有研究显示,California观察到的季节性温度变化趋势也与气溶胶浓度变化趋势是一致的,这些数据表明,气溶胶浓度与近地面气温呈负相关关系,气温气溶胶浓度增大可能导致近地面气温下降,相反,人为气溶胶浓度的减少导致所观察到的近地面气温上升。由于气溶胶的降温效应,因此能部分抵消温室效应导致的气温升高,继而影响植物生长 [18]。此外,气溶胶的辐射效应还会使陆地和海洋之间的温度差变小,使得季风环流减弱,减少了降雨量并改变了降水格局 [11] [19] [20]。
现阶段对气溶胶共同变化的冠层温度,空气湿度,饱和水汽压差(vapor pressure deficit, VPD)等环境因子可能会对陆地生态系统产生的影响研究较少,且没有进行定量化的深入分析 [5] [21] [22]。由于分析数据通常以实测为主,缺少系统的研究,无法剥离气溶胶对环境因素的影响,使得无法评估气溶胶对温度等环境因素条件的影响,这在很大程度上影响区域碳平衡的估计。所以进一步系统地研究雾霾对植物光合的冠层光合的影响是非常必要的。因此本研究利用区域动力–化学耦合模式(Weather Research and Forecasting Chemical model, WRF-Chem),与VPM模型。通过WRF-Chem并设立对比试验(无人为源影响),获得气溶胶对环境因素(温度)的影响,再利用VPM模型,探究由于气溶胶产生的外界环境的变化(温度)对植物初级生产力的影响。
2. 试验设计与研究区域介绍
本研究选取2016年4月6日华北地区的雾霾天气为例,将以欧洲中期天气预报中心(ECMWF)的再分析数据作为驱动数据,人为源排放数据来自中国多分辨率排放清单共享平台利用采用WRF-Chem模拟得到的雾霾事件中的现实气象数据(温度),及对照试验的气象数据模拟结果。将得到的气温数据结合MODIS的增强植被指数(EVI),陆地表面水分指数(LSWI)数据和土地覆盖分类产品(MCD12Q1),以及Himawar-8的PAR数据,运用VPM模型得到区域尺度下的植被总初级生产力(GPP),并与无气溶胶影响下得到的结果进行比较。最后分析在有无气溶胶影响下环境因子(气温)对植被区域尺度总初级生产力的影响强度。
研究地区华北平原是中国第二大平原,位于黄河下游,由黄河、淮河、海河等冲积而成。跨越北京、天津、河北、河南、安徽、江苏、山西等省(直辖市),面积约32.6万km2,粮食作物以冬小麦、夏玉米为主。华北平原属于暖温带季风气候,四季变化明显,地势平坦,海拔多在50 m以下,便于耕作,加以土质肥沃,夏季炎热多雨,年降水量丰富,自古以来为中国重要的农业区 [23]。
3. 数据介绍
3.1. ECMWF数据
本文使用 ECMWF 的再分析资料作为气象驱动数据(http://www.ecmwf.int/products/data/),该数据包括的气象参数有边界层高度、湿度、风向、风速、气温、气压等气象参数,数据空间分辨率为0.125˚ × 0.125˚。
3.2. 人为源数据
本研究模拟时段为2016年,选用的中国多分辨率排放清单共享平台(MEIC, Multi-resolution Emission Inventory for China)获取人为源排放数据(http://www.meicmodel.org) [24]。版本为MEICv.1.3,空间分辨率0.25˚ × 0.25˚。
3.3. MODIS数据
模型运行所需的植被指数EVI和LSWI是由MODIS陆地产品的地表反射率产品MOD09A1 (http://ladweb.nascom.nasa.gov/),计算得到的 [25] [26]。该产品空间分辨率500 m,时间分辨率8天。本研究选用在研究时间内4月6日和4月14日地表反射率数据代表的其前后4天的地表反射率。
本研究选用基于IGBP土地覆盖分类方法。空间分辨率为500 m,来提供不同生物群系的温度及相关信息。MCD12Q1的分类方案见表1。本研究采用的方案是IGBP全球植被分类 [27]。
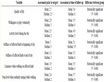
Table 1. MCD12Q1 classification scheme
表1. MCD12Q1分类方案
本研究利用2016年4月的光合有效辐射,选用的为全幅图像,时间分辨率为1小时,PAR数据单位为μmol/m2/s,与本研究最大光能利用率 的单位g C m−2∙d−1∙(W∙m−2)−1不通用,所以需要进行单位换算,其换算系数为0.219 [28]。
4. 模型介绍
4.1. WRF-Chem介绍
WRF-Chem模式作为新一代中尺度预报模式,是在WRF模式基础上引进了化学模块,实现了气象模块和化学模块的完全在线耦合。该模式考虑了大气污染物的平流输送、湍流扩散、干湿沉降、气相化学、气溶胶形成和光解率等过程,可用于雾霾天气过程的数值模拟 [29]。
4.2. VPM模型介绍
VPM模型是基于光能利用率原理建立的植被生产力模型。该模型具有结构简单,模拟精度高的特点,目前已被广泛运用于区域和全球尺度生态系统生产力的估算研究中 [30] [31] [32]。VPM的驱动变量包含:遥感数据为驱动变量和涡度相关通量数据。模型的原理为,利用光合有效辖射(absorbed photosynthetic active radiation APAR)与植被吸收的光能利用率相乘获得GPP。植被冠层由非光合有效植被(nonphotosynthetic vegetation, NPV)和光合有效植被(photosynthetically active vegetation, PAV)两部分组成VPM模型,而相应地,冠层利用的PAR比例( )也由两个部分组成:
(4.1)
因此,VPM的计算公式为:
(4.2)
PAR为光合有效福射; 为绿色叶片吸收光合有效辐射的比率。模型中光能利用率( )受温度限制因子( ) [33] 和最大光能利用率( )、水分限制因子( )以及物候( )的函数 [34] 影响。公式如下:
(4.3)
(4.4)
式中:T为气温(℃); , 和 分别为植被光合作用最低、最高和最适温度,当T小于 时, 设为0。 是表示最大光能利用率,其数值随生物群系变化的参数, , 和 采用经验值,如表2所示 [35]。
表示水分对光能利用率的影响并使用地表水指数(LSWI)进行计算。
(4.5)
式中 为生长季最大陆地表面水分指数。
式(4.2)中, 表示为EVI的线性函数:
(4.6)
式中 等于1 [30]。
增强植被指数(EVI)和陆地表面水分指数(LSWI),用于模型模拟:
(4.7)
(4.8)
Table 2. List of relevant parameters of different biomes
表2. 各生物群系相关参数列表
式中: 、 、 和 分别是红波段、近红外波段、短红波段和蓝波段的地表反射率。
表征叶龄对光合作用的影响。叶片出现到充分舒展阶段的计算公式为:
(4.9)
叶片舒展后:
(4.10)
5. WRF-Chem模型模拟结果分析
图1、图2分别是4月6日白天的气溶胶浓度分布和白天的平均温度分布图,受气溶胶的影响,在大部分地区,如北面的燕山山脉,西面为太行山脉沿线,山东省,江苏省,安徽省,河南省交界处,出现明显降温区域,最低降温达到2℃。但研究显示并不是PM 2.5浓度越高降温越明显。其主要的原因:
1) 当地的下行短波辐射值高于其他地方,导致PM 2.5浓度相对高值区较低时也能引起较大的降温。
2) 不同种类气溶胶,对气温的影响不同。很多研究表明气溶胶对辐射的直接效应和间接效应影响不同,导致气温受到的影响纯在差异,已经证明不同种类的气溶胶种类如: 、 和BC。 和 气溶胶属于散射型气溶胶,能够吸收和散射太阳辐射,从而产生降温效应。黑碳气溶胶作为重要的吸收性气溶胶,对太阳辐射有强烈吸收,从而加热大气。虽然这样能减少到达地表的短波辐射,但是地面气温还是会因为黑碳的吸收效应增加;黑碳气溶胶间接辐射强迫很小并且有时事增温有时事降温,具有很强的不确定性,这主要是由于云的反馈过程比较复杂造成的 [36] [37] [38] [39]。

Figure 1. PM 2.5 average concentration distribution on April 6
图1.

Figure 2. Average temperature distribution in daytime on April 6
图2. 4月6日白天的平均温度分布图
6. 气溶胶环境效应对区域尺度GPP的影响
本研究以4月6日的雾霾情况为例分析气溶胶对区域尺度GPP的影响。如图3、图4是4月6日GPP有无气溶胶状况,图片去除水体,未分类,背景值,城市和建筑区土地类型等地物类型。由于气象要素对GPP的影响在−0.2 g C m−2∙day−1~0.2 g C m−2∙day−1,所以仅观察GPP分布图很难分析气溶胶对GPP的影响。
图5是4月6日研究区无气溶胶下环境下GPP减去有气溶胶下环境GPP,得到GPP的变化趋势图。

Figure 3. GPP in the study area without aerosol influence on April 6
图3. 4月6日无气溶胶影响下研究区GPP

Figure 4. GPP in the study area under the influence of aerosol on April 6
图4.
图6则是对4月6日研究区GPP变化趋势除以无气溶胶影响下GPP变化百分比。图7是4月6日研究区无气溶胶下环境下气温减去有气溶胶下环境气温,得到的气温变化趋势图。图8则是对4月6日研究区GPP变化趋势除以无气溶胶影响下的气温变化百分比。GPP研究区PM 2.5平均浓度分布图和GPP分布图。由图7与图8可以看出,在山东省,江苏省,河南省,安徽省交界处同时存在降温,降温范围在1℃~2℃,5%~8%,而在苏北地区存在一定范围的增温,增温范围在0.5℃~1℃,2%~5%,气温差值与气温变化百分比变化幅度,基本一致,同时图5、图6在同一地区GPP减少和增加,减少为0.05 g C m−2∙day−1~0.2 g C m−2∙day−1,2%~5%,增加为0.05 g C m−2∙day−1~0.1 g C m−2∙day−1,1%~5%。在山东省东部区域也存在一定程度升温最高1℃,6%,GPP变化百分比也出现高增量最高5%,但GPP差值并数值不高最高为0.05 g C m−2∙day−1,但GPP变化百分比却显示很高超过5%。其主要原因是见图3当地GPP在无气溶胶环境下小于1 g C m−2∙day−1,其基数相较于其他地区较低。

Figure 5. GPP difference in the presence or absence of aerosol on April 6
图5. 4月6日有无气溶胶环境下GPP差值
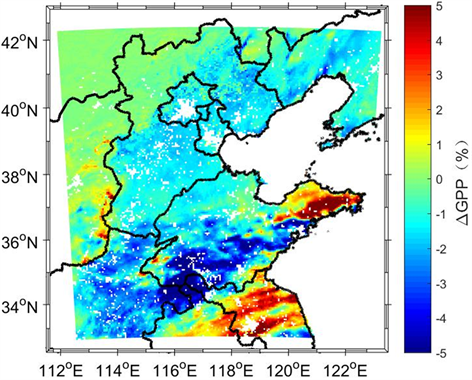
Figure 6. Percentage change of GPP under the influence of aerosol on April 6
图6. 4月6日气溶胶影响下GPP变化百分比
7. 气溶胶环境效应对区域尺度GPP的影响
本研究对2016年4月1日~2016年4月17日华北地区,雾霾天气产生的气溶胶环境效应(气温)对植物GPP在总平均值,区域尺度和不同植物种类的影响。主要研究结果如下:

Figure 7. Air temperature difference in the presence or absence of aerosol on April 6
图7. 4月6日有无气溶胶环境下气温差值
Figure 8. Percentage change of air temperature with or without aerosol on April 6
图8. 4月6日有无气溶胶环境下气温变化百分
1) 从区域尺度分析,气溶胶模拟结果出现两个高值区域分别是北面的燕山山脉,西面为太行山脉沿线。其原因为山体的阻挡与疏导作用。此结果与龙鑫 [40] 等人的研究结果相一致。气溶胶环境效应与气溶胶的关系受下行辐射与气溶胶种类影响,导致气温不能随PM 2.5浓度同步变化,甚至在一些区域出现气温升高的现象。气溶胶环境效应(气温)变化会影响植被气孔导度,光合、呼吸、蒸腾等代谢过程。受气溶胶影响,白天平均气温均有所下降,下降范围为0.350%~2.667%。从而导致2016年4月6日整个研究区平均GPP下降0.03%~2.55%。
2) 气溶胶环境效应(气温)总体以降温为主,但存在区域性增温,导致部分地区GPP最高增加超过5%,但其地区本身GPP小于1 g C m−2∙day−1,其变化绝对值很小。GPP绝对值减少的地区位于山东省,江苏省,河南省,安徽省交界处,减少数值为0.05 g C m−2∙day−1~0.2 g C m−2∙day−1,增加绝对值在苏北地区增加数值为0.05 g C m−2∙day−1~0.1 g C m−2∙day−1。
本研究虽然获得实验时间内气溶胶环境效应对GPP产生负面影响,其主要原因是本研究的研究时间设置在4月份,气温低于植物最适温度,当出现降温时,导致GPP减少。而有研究表明当实验设计在夏天时,气溶胶引发的降温可以缓解温室气体产生的增温,从而增加GPP [41] [42]。所以在之后的研究中需要在更长时间尺度中探究气溶胶环境效应对GPP的影响。
文章引用
高牧原. 气溶胶的环境效应(气温)对植被总初级生产力的影响
Environmental Effect Condition (Air Temperature) of Aerosols on Gross Primary Productivity of Vegetation[J]. 世界生态学, 2020, 09(02): 210-222. https://doi.org/10.12677/IJE.2020.92027
参考文献
- 1. 张安定. 遥感原理与应用题解[M]. 北京: 科学出版社, 2016.
- 2. Hsu, N.-C., Gautam, R., Sayer, A.-M., et al. (2012) Global and Regional Trends of Aerosol Optical Depth over Land and Ocean Using SeaWiFS Measurements from 1997 to 2010. Atmospheric Chemistry and Physics, 12, 8037-8053. https://doi.org/10.5194/acp-12-8037-2012
- 3. Yoon, J., Burrows, J.-P., Vountas, M., et al. (2014) Changes in Atmospheric Aerosol Loading Retrieved from Space-Based Measurements during the Past Decade. Atmospheric Chemistry and Physics, 14, 6881-6902. https://doi.org/10.5194/acp-14-6881-2014
- 4. Hu, T., Sun, Z.B. and Li, Z.X. (2011) Features of Aerosol Optical Depth and Its Relation to Extreme Temperatures in China during 1980-2001. Acta Oceanologica Sinica, 30, 33-45. https://doi.org/10.1007/s13131-011-0103-x
- 5. Gu, L.H., Baldocchi, D., Verma, S.B., et al. (2002) Advantages of Diffuse Radiation for Terrestrial Ecosystem Productivity. Journal of Geophysical Research Atmospheres, 107, 1-2. https://doi.org/10.1029/2001JD001242
- 6. Mercado, L.M., Bellouin, N., Sitch, S., et al. (2009) Impact of Changes in Diffuse Radiation on the Global Land Carbon Sink. Nature, 458, 1014-1017. https://doi.org/10.1038/nature07949
- 7. Cohan, D.S., Xu, J., Greenwald, R., et al. (2002) Impact of Atmospheric Aerosol Light Scattering and Absorption on Terrestrial Net Primary Productivity. Global Biogeochemical Cycles, 16, 31-37. https://doi.org/10.1029/2001GB001441
- 8. Knohl, A. and Baldocchi, D.D. (2008) Effects of Diffuse Radiation on Canopy Gas Exchange Processes in a Forest Ecosystem. Journal of Geophysical Research: Biogeosciences, 113, Article ID: G02023. https://doi.org/10.1029/2007JG000663
- 9. Hansen, J., Nazarenko, L., Ruedy, R., et al. (2005) Earth’s Energy Imbalance: Confirmation and Implications. Science, 308, 1431-1435. https://doi.org/10.1126/science.1110252
- 10. Liepert, B.G., Feichter, J., Lohmann, U., et al. (2004) Can Aerosols Spin Down the Water Cycle in a Warmer and Moister World? Geophysical Research Letters, 31, Article ID: L06207. https://doi.org/10.1029/2003GL019060
- 11. Ramanathan, V., Crutzen, P.-J., Kiehl, J.-T., et al. (2001) Aerosols, Climate, and the Hydrological Cycle. Science, 294, 2119-2124. https://doi.org/10.1126/science.1064034
- 12. Lohmann, U. and Feichter, J. (2005) Global Indirect Aerosol Effects: A Review. Atmospheric Chemistry & Physics, 5, 715-737. https://doi.org/10.5194/acp-5-715-2005
- 13. Natalie, M. (2011) Aerosol Indirect Effect on Biogeochemical Cycles and Climate. Science, 334, 794-796. https://doi.org/10.1126/science.1207374
- 14. Mahowald, N.-M., Engelstaedter, S., Luo, C., et al. (2009) Atmos-pheric Iron Deposition: Global Distribution, Variability, and Human Perturbations. Ann Rev Mar Sci, 1, 245-278. https://doi.org/10.1146/annurev.marine.010908.163727
- 15. Rosenfeld, D., Lohmann, U., Raga, G.B., et al. (2008) Flood or Drought: How do Aerosols Affect Precipitation? Science, 321, 1309-1313. https://doi.org/10.1126/science.1160606
- 16. Osborne, J.-M. and Lambert, F.-H. (2013) The Response of Northern Hemisphere Mid-Latitude Precipitation to Aerosol Forcing.
- 17. Parry, M.L. (2007) Climate Change 2007, Working Group II Contribution to the Fourth Assessment Report of the IPCC Intergovernmental Panel on Climate Change.
- 18. Novakov, T., Kirchstetter, T.-W., Menon, S., et al. (2008) Response of California Temperature to Re-gional Anthropogenic Aerosol Changes. Geophysical Research Letters, 35, 116-122. https://doi.org/10.1029/2008GL034894
- 19. Song, F.F., Zhou, T.J. and Qian, Y. (2014) Responses of East Asian Summer Monsoon to Natural and Anthropogenic Forcings in the 17 Latest CMIP5 Models. Geophysical Research Let-ters, 41, 596-603. https://doi.org/10.1002/2013GL058705
- 20. Zhang, H., Wang, Z.L., Wang, Z.Z., et al. (2012) Simulation of Direct Radiative Forcing of Aerosols and Their Effects on East Asian Climate Using an Interactive AGCM-Aerosol Coupled System. Climate Dynamics, 38, 1675-1693. https://doi.org/10.1007/s00382-011-1131-0
- 21. Arden, G. and Liu, Y.M. (2006) Effect of Smoke and Clouds on the Transmissivity of Photosynthetically Active Radiation inside the Canopy. Atmospheric Chemistry & Physics Dis-cussions, 6, 5909-5934. https://doi.org/10.5194/acpd-5-5909-2005
- 22. Min, Q.L. (2005) Impacts of Aerosols and Clouds on For-est-Atmosphere Carbon Exchange. Journal of Geophysical Research Atmospheres, 110, Article ID: D06203. https://doi.org/10.1029/2004JD004858
- 23. 赵晶晶, 刘良云, 徐自为, 等. 华北平原冬小麦总初级生产力的遥感监测[J]. 农业工程学报, 2011, 27(S1): 346-351.
- 24. Zhang, R.Y., Wang, L., Khalizov, A.-F., et al. (2009) For-mation of Nanoparticles of Blue Haze Enhanced by Anthropogenic Pollution. Proceedings of the National Academy of Sciences, 106, 17650-17654. https://doi.org/10.1073/pnas.0910125106
- 25. Huete, A.R., Liu, H.Q., Batchily, K. and van Leeuwena, W. (1997) A Comparison of Vegetation Indices over a Global Set of TM Images for EOS-MODIS. Remote Sensing of Environment, 59, 440-451. https://doi.org/10.1016/S0034-4257(96)00112-5
- 26. Xiao, X., Boles, S., Frolking, S., et al. (2010) Observation of Flooding and Rice Transplanting of Paddy Rice Fields at the Site to Landscape Scales in China Using VEGETATION Sensor Data. International Journal of Remote Sensing, 23, 3009-3022. https://doi.org/10.1080/01431160110107734
- 27. Loveland, T.R., Reed, B.C., Brown, J.F., et al. (2000) Devel-opment of a Global Land Cover Characteristics Database and IGBP DIS Cover from 1 km AVHRR Data. International Journal of Remote Sensing, 21, 1303-1330. https://doi.org/10.1080/014311600210191
- 28. 周允华, 项月琴, 栾禄凯. 光合有效量子通量密度的气候学计算[J]. 气象学报, 1996(4): 447-455.
- 29. Grell, G.A., Peckham, S.E., Schmitz, R., et al. (2005) Fully Coupled “Online” Chemistry within the WRF Model. Atmospheric Environment, 39, 6957-6975. https://doi.org/10.1016/j.atmosenv.2005.04.027
- 30. Xiao, X.M., Zhang, Q.Y., Braswell, B., et al. (2004) Mod-eling Gross Primary Production of Temperate Deciduous Broadleaf Forest Using Satellite Images and Climate Data. Remote Sensing of Environment, 91, 256-270. https://doi.org/10.1016/j.rse.2004.03.010
- 31. Xiao, X.M., Hollinger, D., Aber, J., et al. (2004) Satellite-Based Modeling of Gross Primary Production in an Evergreen Needleleaf Forest. Remote Sensing of Environment, 89, 519-534. https://doi.org/10.1016/j.rse.2003.11.008
- 32. 贾文晓, 刘敏, 尹才, 等. 基于FLUXNET观测数据与VPM模型的森林生态系统光合作用关键参数优化及验证[J]. 应用生态学报, 2016, 27(4): 1095-1102.
- 33. Raich, J.-W., Rastetter, E.-B., Melillo, J.-M., et al. (1991) Potential Net Primary Productivity in South America: Application of a Global Model. Ecological Applications, 1, 399-429. https://doi.org/10.2307/1941899
- 34. Running, S.-W., Nemani, R.-R., Heinsch, F.-A., et al. (2004) A Continuous Satellite-Derived Measure of Global Terrestrial Primary Production. Bioscience, 54, 547-560. https://doi.org/10.1641/0006-3568(2004)054[0547:ACSMOG]2.0.CO;2
- 35. Zhang, Y. and Xiao, X.M., Jin, C., et al. (2016) Consistency between Sun-Induced Chlorophyll Fluorescence and Gross Primary Production of Vegetation in North America. Remote Sensing of Environment, 183, 154-169. https://doi.org/10.1016/j.rse.2016.05.015
- 36. Ackerman, A.-S., Toon, O.-B., Stevens, D.-E., et al. (2000) Reduc-tion of Tropical Cloudiness by Soot. Science, 288, 1042-1047. https://doi.org/10.1126/science.288.5468.1042
- 37. Kristjánsson, J.-E. (2002) Studies of the Aerosol Indirect Effect from Sulfate and Black Carbon Aerosols. Journal of Geophysical Research: Atmospheres, 107, 1. https://doi.org/10.1029/2001JD000887
- 38. Highwood, E.-J. and Kinnersley, R.-P. (2006) When Smoke Gets in Our Eyes: The Multiple Impacts of Atmospheric Black Carbon on Climate, Air Quality and Health. Environment In-ternational, 32, 560-566. https://doi.org/10.1016/j.envint.2005.12.003
- 39. Bond, T.C., Doherty, S.J., Fahey, D.W., et al. (2013) Bounding the Role of Black Carbon in the Climate System: A Scientific Assessment. Journal of Geophysical Research: Atmos-pheres, 118, 5380-5552. https://doi.org/10.1002/jgrd.50171
- 40. 龙鑫. 基于卫星遥感观测和WRF-Dust/Chem的空气质量模拟[D]: [博士学位论文]. 北京: 中国科学院研究生院(地球环境研究所), 2016.
- 41. Xu, Y., Unger, N., Harper, K., et al. (2017) Ozone and Haze Pollution Weakens Net Primary Productivity in China. Atmospheric Chemistry and Physics, 17, 6073-6089. https://doi.org/10.5194/acp-17-6073-2017
- 42. Novakov, T., Kirchstetter, T.W., Menon, S., et al. (2008) Response of California Temperature to Regional Anthropogenic Aerosol Changes. Geophysical Research Letters, 35, L19808. https://doi.org/10.1029/2008GL034894