Advances in Environmental Protection
Vol.
12
No.
05
(
2022
), Article ID:
57107
,
10
pages
10.12677/AEP.2022.125131
德州市秋冬季大气二次颗粒物污染 变化特征
左敬友1*,罗德耀2,汤梅3
1山东省德州生态环境监测中心,山东 德州
2广州禾信仪器股份有限公司,广东 广州
3广东省麦思科学仪器创新研究院,广东 广州
收稿日期:2022年9月20日;录用日期:2022年10月19日;发布日期:2022年10月26日

摘要
通过对德州市秋冬季大气二次颗粒物(SPM)污染变化特征进行分析,发现在PM2.5重污染发生时,硝酸盐在PM2.5中的占比显著升高,而有机碳(OC)占比降低,凸显了氮氧化物削减对PM2.5污染防控的重要性;此外,对二次有机碳(SOC)进行分析,发现SOC/OC值随K+/EC (元素碳)值的升高而增加,说明生物质燃烧对二次气溶胶(SOA)生成有一定的贡献;进一步特征分析,发现SOC/OC值随着风速的增加而增加;结合玫瑰图分析,发现区域传输对SOC有一定贡献,并且高大气光化学氧化剂(Ox)或高相对湿度(RH)条件不利于SOC生成,但是高温和高RH条件有利于二次无机盐(包括硫酸盐和硝酸盐)的生成。
关键词
二次颗粒物,化学组分,污染特征,秋冬季

The Change Characterization of Atmospheric Secondary Particulate Matter Pollution during Autumn and Winter in Dezhou City
Jingyou Zuo1*, Deyao Luo2, Mei Tang3
1Dezhou Ecological Environment Monitoring Center in Shandong, Dezhou Shandong
2Guangzhou Hexin Instrument Co., Ltd., Guangzhou Guangdong
3Guangdong MS Institute of Scientific Instrument Innovation, Guangzhou Guangdong
Received: Sep. 20th, 2022; accepted: Oct. 19th, 2022; published: Oct. 26th, 2022

ABSTRACT
In this study, the change characteristics of the atmospheric secondary particulate matter (SPM) pollution in Dezhou city during autumn and winter were analyzed. It is found that the proportion of nitrate in PM2.5 increased significantly when PM2.5 level was high, but the proportion of organic carbon (OC) decreased. The result highlights the importance of controlling nitrogen oxide emission to reduce high PM2.5 episodes. In addition, the analysis of the secondary organic carbon (SOC) showed that the SOC/OC ratio increased with the increase of K+/EC (elemental carbon), indicating that biomass burning has a certain contribution to the formation of secondary aerosols (SOA). It is also found that SOC/OC increased with the increase of wind speed. Combined with wind-rose diagram analysis, it implies that regional transport has a certain contribution to SOC. Further analysis showed that high Ox or high RH conditions were unfavorable for SOC formation. In contrast, high temperature and high RH conditions were favorable for the formation of secondary inorganic salts (including sulfate and nitrate).
Keywords:Secondary Particulate Matter, Chemical Composition, Pollution Characteristics, Autumn and Winter

Copyright © 2022 by author(s) and Hans Publishers Inc.
This work is licensed under the Creative Commons Attribution International License (CC BY 4.0).
http://creativecommons.org/licenses/by/4.0/


1. 引言
由高浓度颗粒物造成的区域性霾污染在我国引起了各种环境问题 [1],一方面造成空气质量的下降 [2],另一方面也对人民的健康构成威胁 [3] [4],此外还对生态和气候产生各种各样的影响 [5] [6]。近年来我国颗粒物污染的整体态势有所好转 [7] [8] [9] [10] [11],但是华北平原的颗粒物浓度仍高值频现 [12] [13] [14],尤其是在秋冬季节。有研究指出,我国严重的颗粒物污染除了与高强度的人为排放直接相关,还受到区域输送和气象条件的影响 [15] [16] [17] [18],因此颗粒物污染的治理必须通过区域联防联控,整个区域统一部署,才能达到改善空气质量的目的。2017年初,我国开展了“2 + 26”城市区域战略 [19],从大气污染传输通道的角度出发,涵盖了华北平原的主要城市,包括北京、天津以及河北省、山西省、山东省和河南省的部分城市。政府在这部分区域及周边地区通过多种措施减少人为排放,以达到缓解霾污染和改善空气质量的目的。目前关于华北平原的颗粒物污染研究大多数集中在超大城市和特大城市,例如北京 [20] [21]、天津 [22]、石家庄 [14] 和济南 [23] [24] [25] 等地,关于大型城市的研究还不多。德州是环保部“2 + 26”京津冀大气污染传输通道城市之一 [19],秋冬季经常出现重污染天气。近年来虽然华北平原的污染物浓度有所降低,但是德州的污染物浓度在“2 + 26”城市里仍处于较高水平 [26] [27] [28]。近年来我国实施的减排措施对一次污染物的降低取得了较好的效果,但是对于二次污染物的治理形势仍然比较严峻。本研究的目的旨在利用高时间分辨率的在线颗粒物化学组分数据,对德州秋冬季大气二次颗粒物污染变化特征进行分析,探究颗粒物二次生成污染的变化特征,为降低该地区的二次颗粒物污染提供科学支撑。
2. 实验和方法
2.1. 观测站点与时段
采样口布置于德州市环境生态保护局大气监测站楼顶(116.38N,37.48E),距离地面12 m。该监测站位于德州市城区中心位置,周边分布有居民区、商业区和公园,人口密集,无明显固定污染源,能代表德州市城区中心位置的环境特点。
观测时段为2017年10月1日至2017年12月31日。在秋冬季划分上,是用候平均气温小于10℃作为冬季的划分条件,从11月14日开始,候平均气温连续一周小于10℃,因此10月1日至11月13日划分为秋季,11月14日至12月31日划分为冬季。
2.2. 观测仪器与数据处理
PM2.5质量浓度使用β射线颗粒物监测仪(BAM 1020, Metone)测得。水溶性离子成分使用在线离子色谱分析仪(IGAC,章嘉)分析,时间分辨率为1 h。OC和EC使用Sunset公司的RT-4在线碳分析仪分析,时间分辨率为1 h。小时分辨率的金属元素质量浓度使用在线元素分析仪(CES Xact 625)测得。气象要素包括风向、风速、温度、相对湿度和气压等均来自于自动气象站(SW 600,斯威高科)。
使用最小相关系数法(MRS)来估算SOC,该方法的优势在于依托于一种示踪物,基于最小相关系数法,可以将一次和二次的物质分开而不依赖于经验百分位数 [29],其可靠性已经在严谨的数值模型实验中得到了验证 [30]。在本研究中使用EC作为示踪物,计算OC和EC的一次比值(OC/EC)pri,进而计算出SOC,步骤如下:
(1)
(2)
POC为一次有机碳;(OC/EC)pri采用所有OC/EC值的最小值;OCnon-comb表示一次排放的OC中的非燃烧过程所产生的OC,由于该项很小,因此在本研究中,OCnon-comb设置为零。
(OC/EC)pri是EC示踪法计算SOC的关键参数。简要计算步骤如下:在MRS方法中设定(OC/EC)pri_h [假设的(OC/EC)pri]在一个合理的范围内连续变化(例如,以0.1的间隔从0.1至10)。SOCh (假设的SOC)通过(OC/EC)pri_h数据集计算得出,然后根据计算出的一系列的EC与SOCh之间的R2进行绘图,基于EC和SOC的变化是独立的假设,最小的R2所对应的(OC/EC)pri_h可以代表真实的一次排放的(OC/EC)pri。
本研究中,考虑到季节性变化和部分二次前体物的干扰效应 [31],每个月单独作为一个子集,然后再划分24小时,分别用MRS计算(OC/EC)pri,然后取每月小时值中的最小值作为该月的(OC/EC)pri,从而计算SOC。10月、11月和12月的(OC/EC)pri分别为1.91,2.49和1.29,与近期德州的相关研究取值范围相近(0.89~1.81) [32]。
3. 结果与讨论
3.1. PM2.5化学组分变化特征
从表1中可以看出,除 外,其余污染物(PM2.5、OC、EC、 、 、Na+、K+和Cl−)质量浓度均为冬季高于秋季,并且冬季OC的质量浓度几乎是秋季的2倍。说明随着温度降低,采暖期到来,排放增加,颗粒物的污染加重。
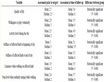
Table 1. Average mass concentrations and standard deviation values of pollutants in autumn and winter [μg∙m−3]
表1. 秋冬季各污染物质量浓度均值及标准差[μg∙m−3]
从图1中可以看出,颗粒物的化学组分随着PM2.5的质量浓度的变化而变化。随着PM2.5浓度的升高, 的占比随之增大,有机物(OM)的占比减少(OM通过OC × 1.8估算),而其他组分的占比在不同浓度下变化不大。说明德州地区在重污染条件下,高浓度的颗粒物贡献主要来自于硝酸盐,因此氮氧化物的削减对于减少PM2.5重污染十分重要。近期多项研究表明,由于大气氧化性的增加以及排放特征的变化,二氧化硫及硫酸盐的污染得到了很好的遏制,但是华北平原硝酸盐在颗粒物中的占比逐年不断上升 [33] [34] [35] [36] [37],需要引起高度重视。
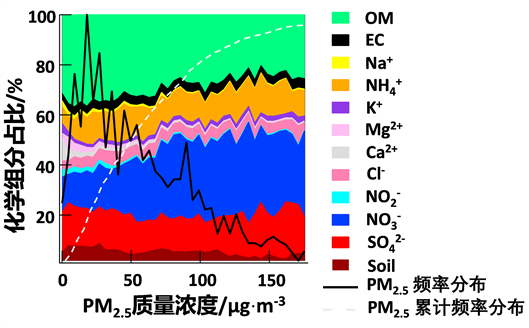
Figure 1. Proportion of chemical components under different PM2.5 mass concen- trations
图1. 不同质量浓度PM2.5下各化学组分占比
通过图2可以看出EC、OC和PM2.5的变化趋势较为一致,均是在风速较高的时候,浓度有所降低。可用于表征生物质燃烧的K+的变化趋势与PM2.5、OC和EC相似,推测颗粒物浓度受生物质燃烧的影响较大。
通过对图3各特征量的日变化进行分析可以看出,OC和EC浓度表现出较为一致的变化趋势。均是在夜晚较高,清晨有所降低,然后在09:00左右开始升高,在中午开始降低,并在16:00达到谷值,推测是受到了边界层的变化和机动车早晚高峰的影响。而OC/EC值可以反映二次气溶胶的生成情况,OC/EC值在11:00开始升高,15:00达到峰值,推测是由于中午的光化学反应较为剧烈,导致OC升高。 、 和 的日变化趋势较为平缓,具有中午较高,下午略降的趋势。
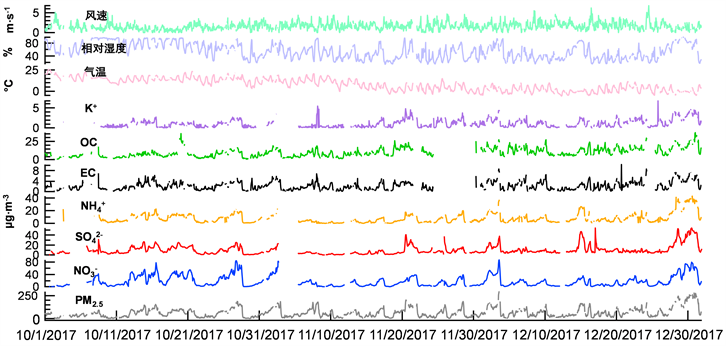
Figure 2. Time variation of pollutants mass concentrations, temperature, relative humidity and wind speed
图2. 各污染物质量浓度、温度、相对湿度和风速的时间变化
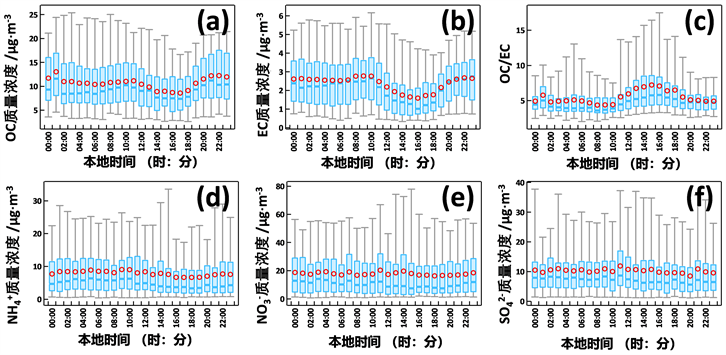
Figure 3. Daily variation of pollutants mass concentrations and OC/EC
图3. 各污染物质量浓度和OC/EC的日变化
3.2. SOC的变化特征及影响因素
SOC/OC值可以较好地表征SOC的生成情况,对SOC/OC值的日变化进行分析。从图4(a)中SOC/OC值的日变化可以看出,在午后SOC/OC值升高,说明光化学反应对SOC的影响较大。通过图4(b)及图4(c)的OC/EC值和SOC/OC值对生物质燃烧指示特征量(K+/EC)的依赖关系图可以看出,随着K+/EC值的增大,OC/EC值和SOC/OC值是升高的,图4(b)中的OC和EC的散点图使用K+/EC值上色,也证实了OC/EC斜率随着K+/EC的增加而增加(斜率大的点同时也对应着颜色更红),因此推测认为生物质燃烧有助于SOC的生成,说明生物质燃烧不仅排放一次颗粒物,其伴随排放的其他前体物在大气老化过程中,对SOA的生成也有贡献。对生物质燃烧进行管控,不仅可以减少一次排放,也可以减少二次污染物生成。
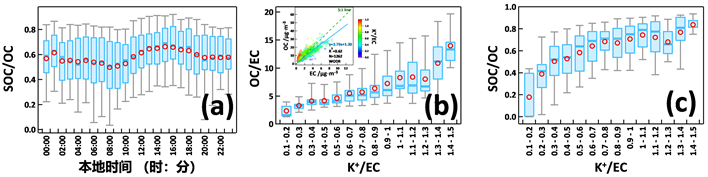
Figure 4. Daily variation characteristics of SOC and dependence of SOC/OC, OC/EC on biomass combustion tracer (K+/EC)
图4. SOC的日变化特征及SOC/OC和OC/EC对生物质燃烧标志物(K+/EC)的依赖性
根据图5(a)所示,SOC/OC对Ox的依赖关系图可以看出,SOC/OC值会随着Ox的升高而降低,推测认为光化学反应不是SOC的主要生成路径,活跃的光化学反应反而会造成SOC/OC值的降低。从SOC/OC对RH的依赖关系[图5(b)]可以看出,在高RH条件下SOC/OC值降低,说明高RH条件不利于SOC的生成。根据SOC/OC对风速的依赖关系[图5(c)]可以看出,高风速下SOC/OC值上升,说明有一定部分的SOC不是本地生成,有可能是区域传输而来。
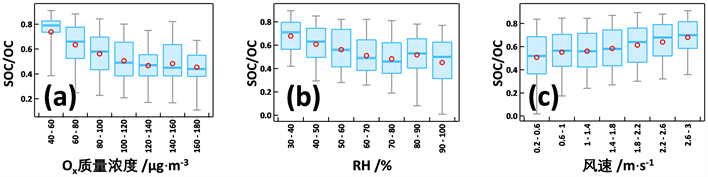
Figure 5. Dependence of SOC/OC on Ox, RH and WS
图5. SOC/OC对Ox、RH和风速的依赖性
使用ZeFir工具包 [38] 绘制风玫瑰图进行分析,观测期间频率最高的是东风[图6(a)],其次是南风和西风。从图6(b)可以看出,风速较高的时候对应K+/EC也出现高值,最高值来自于东北方,这意味着生物质燃烧主要是来自于区域输送。从SOC/OC的风场图[图6(c)]可以看出,而SOC/OC的高值出现在偏东北方向,并且在风速低时SOC/OC较低,高值均出现在高风速条件下,因此可以证实,本研究观测到的SOC贡献有很大一部分来自于区域传输而不是本地生成。以往研究指出,华北平原颗粒物污染的区域传输特性十分明显 [39],因此仅靠本地减排措施可能对二次颗粒物管控的效果有限,必须通过联防联控措施对空气质量进行有效管理。
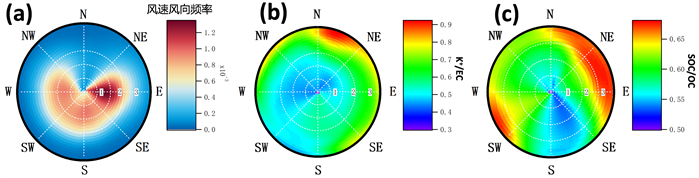
Figure 6. Wind rose pictures of K+/EC and SOC/OC
图6. K+/EC和SOC/OC风玫瑰图
3.3. 二次无机盐的变化特征及影响因素
SOR (硫的氧化速率)和NOR (氮的氧化速率)一般用来表征SO2和NO2在大气中被氧化的程度,是二次无机盐气体前体物二次转化的重要指标 [40]。
(3)
(4)
式中[]表示摩尔浓度, 代表 中非海盐成分,可以通过这两个公式算得: ,。NOR和SOR的值越高,说明NO2和SO2向 和 的转化几率就越大,二次无机盐的生成越活跃。
从图7(a)和图7(b)可以看,随着温度的升高,SOR和NOR也随之升高,其中NOR对温度的依赖性更明显,较高的温度可能从多方面与SOR和NOR产生关联:一种可能是较高的温度可以提高化学反应速率;另一种可能是较高的温度代表着较强的太阳辐射,对光化学反应有促进作用。同时,出随着湿度的升高[图7(c)和图7(d)],SOR和NOR都随之升高,说明高湿度环境有利于硫酸盐和硝酸盐生成,但SOR和NOR随湿度的变化情况并不相同,SOR在相对湿度接近50%后开始逐步升高,到90%以后接近饱和,而NOR是从20%开始逐渐升高,到达80%后接近饱和并保持稳定。从图7(e)和图7(f)也可以看出,SOR和NOR对Ox的依赖性也意味着光化学反应对硫酸盐和硝酸盐的生成也有促进作用。近期在华北平原基于氮同位素的研究发现,气相(NOx + OH)和非均相(N2O5 + H2O)反应对硝酸盐生成的贡献相当 [41],这和本研究发现的NOR对于温度和湿度均有正相关的现象是相吻合的。由图7(g)和图7(h)可见,SOR和NOR随着风速增加而降低,这个与SOC跟风速的关系相反,说明本研究中硫酸盐和硝酸盐生成在扩散条件良好的时候受到了抑制。
从表2可以看到,秋冬季的NOR和SOR均值差异不大,说明二次无机盐生成的秋冬季节差异不大,而SOC/OC和K+/EC这两个特征量均为冬季高于秋季,结合表1中OC的季节浓度差异,说明入冬后的采暖季主要对SOC有贡献,而EC的季节性差异几乎可以忽略不计,采暖对EC的贡献较小。
Table 2. Statistics of characteristic quantities in autumn and winter
表2. 秋冬季各特征量统计
4. 结论
通过对德州市秋冬季大气二次颗粒物污染变化特征进行分析,发现在PM2.5重污染发生时,硝酸盐在PM2.5中的占比显著升高,而OC占比降低,凸显了氮氧化物削减对于PM2.5重污染管控的重要性。因此从空气质量管理的角度来看,进一步控制燃烧源的氮氧化物排放是十分必要的,一方面是进一步通过提高电动车的占比来减少机动车的氮氧化物排放,另一方面需要降低燃煤电厂的氮氧化物排放。此外,研究发现SOC/OC值对于K+/EC有显著的依赖性,说明生物质燃烧对于SOA生成有一定的贡献。进一步控制好人为源的生物质燃烧排放,对于控制二次有机气溶胶的浓度是很有必要的。通过特征分析,发现
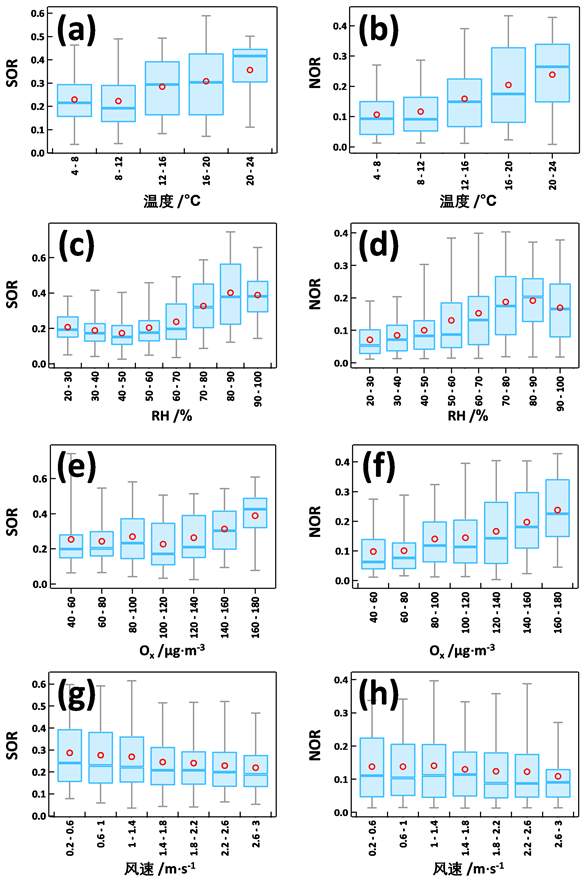
Figure 7. Dependencies of SOR and NOR on different parameters
图7. SOR和NOR对不同参量的依赖关系
区域传输对SOC有一定贡献,并且高Ox或高RH条件不利于SOC生成,但是高湿条件有利于二次无机盐的生成(包括硫酸盐和硝酸盐)。因此,降低颗粒物污染要着重对氮氧化物和生物质燃烧排放进行管控。此外区域性联防联控也十分重要,因为SOC的输送特性十分明显,说明有相当一部分SOC不是本地生成的,如果仅靠本地的减排措施,较难进一步降低颗粒物的浓度。
文章引用
左敬友,罗德耀,汤 梅. 德州市秋冬季大气二次颗粒物污染变化特征
The Change Characterization of Atmospheric Secondary Particulate Matter Pollution during Autumn and Winter in Dezhou City[J]. 环境保护前沿, 2022, 12(05): 1056-1065. https://doi.org/10.12677/AEP.2022.125131
参考文献
- 1. 吴兴贺, 殷耀兵, 谭瑞, 等. 华北区域点冬季二次有机气溶胶特征与影响因素[J]. 环境科学学报, 2020, 40(1): 58-64.
- 2. 王跃思, 姚利, 刘子锐, 等. 京津冀大气霾污染及控制策略思考[J]. 中国科学院院刊, 2013, 28(3): 353-363.
- 3. Wang, Y., Chen, Y., Wu, Z., et al. (2020) Mutual Promotion between Aerosol Particle Liquid Water and Particulate Nitrate Enhancement Leads to Severe Nitrate-Dominated Particulate Matter Pollution and Low Visibility. Atmospheric Chemistry and Physics, 20, 2161-2175. https://doi.org/10.5194/acp-20-2161-2020
- 4. Xu, Q., Wang, S., Jiang, J., et al. (2019) Nitrate Dominates the Chemical Composition of PM2.5 during Haze Event in Beijing, China. Science of the Total Environment, 689, 1293-1303. https://doi.org/10.1016/j.scitotenv.2019.06.294
- 5. Li, H., Zhang, Q., Zheng, B., et al. (2018) Nitrate-Driven Urban Haze Pollution during Summertime over the North China Plain. Atmospheric Chemistry and Physics, 18, 5293-5306. https://doi.org/10.5194/acp-18-5293-2018
- 6. Li, H., Cheng, J., Zhang, Q., et al. (2019) Rapid Transition in Winter Aerosol Composition in Beijing from 2014 to 2017: Response to Clean Air Actions. Atmospheric Chemistry and Physics, 19, 11485-11499. https://doi.org/10.5194/acp-19-11485-2019
- 7. Leung, D.M., Shi, H., Zhao, B., et al. (2020) Wintertime Partic-ulate Matter Decrease Buffered by Unfavorable Chemical Processes despite Emissions Reductions in China. Geophysical Research Letters, 47, e2020GL087721. https://doi.org/10.1029/2020GL087721
- 8. Petit, J.E., Favez, O., Albinet, A., et al. (2017) A User-Friendly Tool for Comprehensive Evaluation of the Geographical Origins of Atmospheric Pollution: Wind and Trajectory Analyses. Environmental Modelling & Software, 88, 183-187. https://doi.org/10.1016/j.envsoft.2016.11.022
- 9. Chen, D., Liu, X., Lang, J., et al. (2017) Estimating the Contribution of Regional Transport to PM2.5 Air Pollution in a Rural Area on the North China Plain. Science of the Total Environment, 583, 280-291. https://doi.org/10.1016/j.scitotenv.2017.01.066
- 10. Squizzato, S., Masiol, M., Brunelli, A., et al. (2013) Factors Determining the Formation of Secondary Inorganic Aerosol: A Case Study in the Po Valley (Italy). Atmospheric Chemistry and Physics, 13, 1927-1939. https://doi.org/10.5194/acp-13-1927-2013
- 11. 吴兑, 吴晓京, 李菲, 等. 1951-2005年中国大陆霾的时空变化[J]. 气象学报, 2010, 68(5): 680-688.
- 12. 白志鹏, 蔡斌彬, 董海燕, 等. 灰霾的健康效应[J]. 环境污染与防治, 2006, 28(3): 198-201.
- 13. 刘帅, 宋国君. 城市PM2.5健康损害评估研究[J]. 环境科学学报, 2016, 36(4): 1468-1476.
- 14. 丁一汇, 李巧萍, 柳艳菊, 等. 空气污染与气候变化[J]. 气象, 2009, 35(3): 3-14+129.
- 15. Kang, S., Zhang, Q., Zhang, Y., et al. (2022) Warming and Thawing in the Mt. Everest Region: A Review of Climate and Environmental Changes. Earth-Science Reviews, 225, Article ID: 103911. https://doi.org/10.1016/j.earscirev.2021.103911
- 16. Zhai, S., Jacob, D.J., Wang, X., et al. (2019) Fine Particulate Matter (PM2.5) Trends in China, 2013-2018: Separating Contributions from Anthropogenic Emissions and Meteorology. Atmospheric Chemistry and Physics, 19, 11031-11041. https://doi.org/10.5194/acp-19-11031-2019
- 17. Zhang, Q., Zheng, Y., Tong, D., et al. (2019) Drivers of Improved PM2.5 Air Quality in China from 2013 to 2017. Proceedings of the National Academy of Sciences, 116, 24463-24469. https://doi.org/10.1073/pnas.1907956116
- 18. Chu, B., Ma, Q., Liu, J., et al. (2020) Air Pollutant Correlations in China: Secondary Air Pollutant Responses to NOx and SO2 Control. Environmental Science & Technology Letters, 7, 695-700. https://doi.org/10.1021/acs.estlett.0c00403
- 19. Lu, X., Zhang, S., Xing, J., et al. (2020) Progress of Air Pollution Control in China and Its Challenges and Opportunities in the Ecological Civilization Era. Engineering, 6, 1423-1431. https://doi.org/10.1016/j.eng.2020.03.014
- 20. Ding, A., Huang, X., Nie, W., et al. (2019) Significant Reduction of PM2.5 in Eastern China Due to Regional-Scale Emission Control: Evidence from SORPES in 2011-2018. Atmospheric Chemistry and Physics, 19, 11791-11801. https://doi.org/10.5194/acp-19-11791-2019
- 21. Liu, X.G., Li, J., Qu, Y., et al. (2013) Formation and Evolution Mechanism of Regional Haze: A Case Study in the Megacity Beijing, China. Atmospheric Chemistry and Physics, 13, 4501-4514. https://doi.org/10.5194/acp-13-4501-2013
- 22. Zhang, Z., Zhang, X., Gong, D., et al. (2016) Possible Influence of Atmospheric Circulations on Winter Haze Pollution in the Beijing-Tianjin-Hebei Region, Northern China. Atmospheric Chemistry and Physics, 16, 561-571. https://doi.org/10.5194/acp-16-561-2016
- 23. Huang, R., Wang, Y., Cao, J., et al. (2019) Primary Emissions versus Secondary Formation of Fine Particulate Matter in the Most Polluted City (Shijiazhuang) in North China. At-mospheric Chemistry and Physics, 19, 2283-2298. https://doi.org/10.5194/acp-19-2283-2019
- 24. An, Z., Huang, R., Zhang, R., et al. (2019) Severe Haze in North-ern China: A Synergy of Anthropogenic Emissions and Atmospheric Processes. Proceedings of the National Academy of Sciences, 116, 8657-8666. https://doi.org/10.1073/pnas.1900125116
- 25. 郝建奇, 葛宝珠, 王自发, 等. 2013年京津冀重污染特征及其气象条件分析[J]. 环境科学学报, 2017, 37(8): 3032-3043.
- 26. 石琳琳, 李令军, 王新辉, 等. 北京市秋冬大气污染传输特征遥感研究[J]. 环境科学学报, 2018, 38(10): 3834-3845.
- 27. 钤伟妙, 张艳品, 陈静, 等. 石家庄大气污染物输送通道及污染源区研究[J]. 环境科学学报, 2018, 38(9): 3438-3448.
- 28. Dao, X., Lin, Y., Cao, F., et al. (2019) Introduction to the National Aerosol Chemical Composition Monitoring Network of China: Objectives, Current Status, and Outlook. Bulletin of the American Meteorological Society, 100, ES337-ES351.
- 29. Ji, D., Gao, M., Maenhaut, W., et al. (2019) The Carbonaceous Aerosol Levels Still Remain a Challenge in the Beijing-Tianjin-Hebei Region of China: Insights from Continuous High Temporal Resolution Measurements in Multiple Cities. Environment International, 126, 171-183. https://doi.org/10.1016/j.envint.2019.02.034
- 30. Sun, Y., Du, W., Fu, P., et al. (2016) Primary and Secondary Aerosols in Beijing in Winter: Sources, Variations and Processes. Atmospheric Chemistry and Physics, 16, 8309-8329. https://doi.org/10.5194/acp-16-8309-2016
- 31. Xu, H., Xiao, Z., Chen, K., et al. (2019) Spatial and Temporal Distribution, Chemical Characteristics, and Sources of Ambient Particulate Matter in the Beijing-Tianjin-Hebei Region. Science of the Total Environment, 658, 280-293. https://doi.org/10.1016/j.scitotenv.2018.12.164
- 32. 刘盈盈, 殷宝辉, 王静, 等. 济南冬季大气重污染过程颗粒物组分变化特征[J]. 环境化学, 2018, 37(12): 2749-2757.
- 33. 刘晓迪, 孟静静, 侯战方, 等. 济南市夏、冬季PM2.5中化学组分的季节变化特征及来源解析[J]. 环境科学, 2018, 39(9): 4014-4025.
- 34. Sun, Y., Zhou, X. and Wang, W. (2016) Aerosol Size Distributions during Haze Episodes in Winter in Jinan, China. Particuology, 28, 77-85. https://doi.org/10.1016/j.partic.2015.12.001
- 35. 陶士康, 张清爽, 安静宇, 等. 基于地基观测及源清单的2017-2019年德州市秋冬季大气污染防治效果评估[J]. 环境科学研究, 2019, 32(10): 1739-1746.
- 36. Dao, X., Ji, D., Zhang, X., et al. (2022) Significant Reduction in Atmospheric Organic and Elemental Carbon in PM2.5 in 2+26 Cities in Northern China. Environmental Research, 2022, Article ID: 113055. https://doi.org/10.1016/j.envres.2022.113055
- 37. 徐伟召, 朱雯斐, 王甜甜, 等. 冬季德州市大气颗粒物消光与化学组成关系研究[J]. 环境科学学报, 2019, 39(4): 1057-1065.
- 38. Millet, D.B. (2005) Atmospheric Volatile Organic Compound Measurements during the Pittsburgh Air Quality Study: Results, Interpretation, and Quantification of Primary and Secondary Contributions. Journal of Geophysical Research, 110, D07S07. https://doi.org/10.1029/2004JD004601
- 39. Wu, C. and Yu, J. (2016) Determination of Primary Combustion Source Organic Carbon-to-Elemental Carbon (OC/ EC) Ratio Using Ambient OC and EC Measurements: Secondary OC-EC Correlation Minimization Method. Atmospheric Chemistry and Physics, 16, 5453-5465. https://doi.org/10.5194/acp-16-5453-2016
- 40. Fan, M., Zhang, Y., Lin, Y., et al. (2020) Changes of Emission Sources to Nitrate Aerosols in Beijing after the Clean Air Actions: Evidence from Dual Isotope Compositions. Journal of Geophysical Research: Atmospheres, 125, e2019JD031998. https://doi.org/10.1029/2019JD031998
- 41. Wu, C., Wu, D. and Yu, J. (2019) Estimation and Uncertainty Analysis of Secondary Organic Carbon Using 1 Year of Hourly Organic and Elemental Carbon Data. Journal of Geo-physical Research: Atmospheres, 124, 2774-2795. https://doi.org/10.1029/2018JD029290
NOTES
*通讯作者。