Hans Journal of Ophthalmology
Vol.
11
No.
02
(
2022
), Article ID:
51060
,
8
pages
10.12677/HJO.2022.112018
比较欧堡眼底图像结合人工智能分析、 OCT及OCTA对垂直杯盘比 一致性分析
黄丽娜1,2*#,官凡钰1*,段阗阗1,林晨3,李强3
1暨南大学附属深圳爱尔眼科医院,广东 深圳
2暨南大学附属深圳眼科医院,广东 深圳
3暨南大学附属深圳市人民医院,广东 深圳
收稿日期:2022年4月8日;录用日期:2022年4月29日;发布日期:2022年5月7日

摘要
目的:评估欧堡Daytona眼底图像结合人工智能分析(artifical intelligence, AI)、蔡司高分辨率光学相干断层扫描仪(ZEISS Cirrus high density coherence tomography, Zeiss Cirrus HD-OCT)及光学相干断层扫描血流成像(optical coherence tomography angiography, OCTA)三种不同影像学技术所分析并计算出的垂直杯盘比(vertical cup/disc ratio, VC/D)大小的差异性及一致性,以指导临床应用。方法:前瞻性,横断面研究。纳入2021年9月~2022年1月在暨南大学附属深圳爱尔眼科医院就诊的患者25例(48只眼)进行OCT、OCTA及欧堡眼底图像联合AI分析检查并计算出视盘参数,对比三种设备测量VC/D的一致性、差异性。结果:OCT、OCTA及欧堡眼底图像联合AI分析三种技术测量VC/D值两两比较存在差异(P < 0.05),其中OCT测量值 > 欧堡眼底图像联合AI分析 > OCTA;经Bland-Altman分析:欧堡眼底照相联合AI分析测量所得VC/D值与OCTA的一致性较其余两组更为接近。其中欧堡眼底图像联合AI分析组与OCTA组测VC/D值95%的LoA:−0.2765~0.3981,6.25%点位于95%的LoA之外,一致性差;欧堡联合AI组与OCT组测VC/D值95%的LoA:−0.2712~0.1838,8.3%点位于95%的LoA之外,一致性差;OCTA组与OCT组测VC/D值95%的LoA:−0.1046~0.12286,8.3%点位于95%的LoA之外,一致性差。结论:三种不同的检查设备对VC/D的测量之间存在差异,一致性差,不同设备之间的VC/D值不可互换。
关键词
OCT,OCTA,AI,杯盘比,青光眼

Comparison of the Consistency of the Vertical Cup/Disc Ratio Analyzed by Daytona Combined with Artificial Intelligence, OCT and OCTA
Lina Huang1,2*#, Fanyu Guan1*, Tiantian Duan1, Chen Lin3, Qiang Li3
1Shenzhen Aier Eye Hospital, Jinan University, Shenzhen Guangdong
2Shenzhen Eye Hospital, Jinan University, Shenzhen Guangdong
3Shenzhen People’s Hospital, Jinan University, Shenzhen Guangdong
Received: Apr. 8th, 2022; accepted: Apr. 29th, 2022; published: May 7th, 2022

ABSTRACT
Objective: To evaluate the difference and consistency of vertical cup/disc ratio analyzed and calculated by Daytona fundus images combined with artificial intelligence analysis (AI), Zeiss Cirrus high resolution optical coherence tomography (Zeiss Cirrus HD-OCT) and optical coherence tomography angiography (OCTA), so as to guide clinical application. Methods: A prospective, cross-sectional study. A total of 25 patients (48 eyes) who were treated in Shenzhen Eye Hospital, Jinan University from September 2021 to January 2022 were included. They all were underwent examination of OCT, OCTA, and Daytona fundus images combined with AI, the optic disc parameters were calculated. The consistency and difference of vertical cup-to-disc ratio measured by three kinds of equipment were compared. Results: There were significant differences in the pairwise comparisons of the VC/D ratio measured by the three techniques of OCT, OCTA and Daytona fundus images combined with AI (P < 0.05). The measured values of vertical cup/disc ratio were OCT > Daytona combined AI > OCTA. The consistency of the VC/D values measured by Daytona fundus images combined with AI analysis group and OCTA group was closer than that of the other two groups. The Bland-Altman plots showed that the 95% of the LoA were −0.2765 ~ 0.3981 between the Daytona fundus images combined with AI group and the OCTA group, 6.25% of the points were outside the 95% LoA, and the consistency was poor; the 95% of the LoA were −0.2712 ~ 0.1838 for Daytona fundus images combined with AI group and OCT group , 8.3 % of the points were outside the 95% LoA, poor consistency; the 95%of the LoA were −0.1046 ~ 0.12286 for OCTA group and OCT group ,8.3 % of the points were outside the 95% LoA, poor consistency. Conclusion: There are differences in the VC/D measurements of the three different devices, the consistency is poor, and the VC/D values between different devices are not interchangeable.
Keywords:OCT, OCTA, AI, Cup/Disc Ratio, Glaucoma

Copyright © 2022 by author(s) and Hans Publishers Inc.
This work is licensed under the Creative Commons Attribution International License (CC BY 4.0).
http://creativecommons.org/licenses/by/4.0/


1. 引言
据报道40~80岁人群的全球青光眼患病率为3.54%,2013年青光眼患病人数达6430万,预计到2040年,患病人数将上升至1.118亿人口 [1] [2]。青光眼是一种以视神经节细胞及轴索进行性损害和丢失的不可逆性致盲眼病,视盘形态学的改变是青光眼诊断、治疗、随访中的重要指标,其中盘沿面积、垂直杯盘比是青光眼早期诊断的重要指标 [3]。以往测量视盘杯盘比大小的方法主要有:眼底镜检查、手动测量眼底照相上视盘直径大小、眼底立体照相,但上诉方法存在着较强的主观性,部分为平面状态、且不同测量者对视盘、视杯的定义也不尽相同,存在操作偏差,工序复杂等。准确、客观的视盘参数测量对于青光眼、生理性大视杯、视神经疾病等的诊断,尤其对于开角型青光眼的早期及可疑青光眼诊断具有重要意义。近年来,随着计算机影像技术的飞速发展,人工智能已在眼科开展应用,人工智能(artificial intelligence, AI)与眼底照相的结合可以自动提取并分析测量出视盘杯盘比大小及眼底图像上有意义的眼底改变,在青光眼的早期诊断和监测疾病进展方面展现了卓越的能力 [4] [5] [6]。目前测量杯盘比大小多种不同仪器,但因每种仪器测量视盘的原理、算法不尽相同,部分测量值也存在差异,因此有必要研究不同仪器测量杯盘比大小的差异。本研究目的为比较欧堡Daytona眼底图像结合AI分析、Zeiss Cirrus HD- OCT及OCTA三种不同影像学技术所分析的垂直杯盘比大小的差异性及一致性,以指导临床应用。
2. 资料与方法
2.1. 一般资料
采用前瞻性临床对比设计,纳入2021年9月~2022年1月在暨南大学附属深圳爱尔眼科医院就诊的患者25例(48只眼),其中青光眼:15例、可疑青光眼:3例、屈光不正:4例、青光眼睫状体炎综合征1例、正常眼2例;男性16例(31只眼),女性9例(17只眼);年龄22~77岁,平均年龄(43.4 ± 13.1)岁。受试眼均接受常规眼科检查,包括视力,眼压,裂隙灯显微镜,裂隙灯下直接检眼镜查眼底,且均进行OCT,OCTA及欧堡眼底照相联合AI等检查;其中平均视力:(0.5 ± 0.36),平均眼压(15.48 ± 4.8 mmHg)。纳入标准:来院就诊青光眼患者或排查青光眼;患者能配合完成OCT、OCTA、欧堡等相关检查;排除标准:视神经水肿杯盘比辨认不清等;眼球震颤、严重白内障等不能配合检查等。
2.2. 方法
研究分为3组,OCT组、OCTA组和欧堡眼底图像联合AI组。本研究设计符合赫尔基宣言。测量时,Zeiss Cirrus HD-OCT选用Optic Disc Cube 200 × 200扫描模式,扫描范围为6 mm × 6 mm × 2 mm;OCTA进行视盘扫描时选用HD Angio Disc扫描模式,扫描范围为4.5 mm × 4.5 mm;均选用信号均匀、信号强度 ≥ 7图像进行分析;欧堡Daytona眼底图像结合AI分析及计算,AI根据眼底图像针对性的对视盘图像进行分析并计算出视杯、视盘的大小得出数据。
2.3. 统计学分析
采用SPSS23.0软件进行数据分析,对所有测量数据进行正态性检验,所有数据均符合正态分布,数据以均数 ± 标准差(X ± S)表示;不同仪器间测量结果的差异性比较采用配对样本T检验,P < 0.05为差异有统计学意义;一致性评价采用Bland-Altman分析,若超过5%的点位于95%的一致性界限(limitation of agreement, LoA)之外,则认为一致性差。
3. 结果
3.1. 三种仪器测量的VC/D参数及差异性比较
OCT组、OCTA组和欧堡眼底图像联合AI分析组,三组仪器测量VC/D经t检验两两比较均有差异性,差异有统计学意义,见表1。图1分别为正常眼、可疑青光眼、青光眼的视盘欧堡图、OCTA、OCT图。
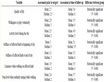
Table 1. Difference analysis of VC/D parameters measured by three instruments
表1. 三种仪器测量VC/D参数差异性分析
 A正常眼三种设备测得垂直杯盘比数值:欧堡联合AI:0.49,OCTA组:0.42,OCT组:0.48;B可疑青光眼三种设备测得垂直杯盘比数值:欧堡联合AI:0.62,OCTA组:0.65,OCT组:0.69;C青光眼三种设备测得垂直杯盘比数值:欧堡联合AI:0.67,OCTA组:0.62,OCT组:0.66。
Figure 1. Optic disc Daytona, OCTA and OCT map of normal eyes, suspected glaucoma, and glaucoma
图1. 正常眼、可疑青光眼、青光眼的视盘欧堡图、OCTA、OCT图
3.2. 三种仪器测量VC/D参数的一致性评估
经过Bland-Altman分析发现三组间两两比较一致性均较差,具体见图2、图3、图4。其中欧堡眼底图像联合AI分析所得VC/D值与OCTA的一致性较其余两组更为接近。
 欧堡眼底图像联合AI分析与OCTA测量VC/D的一致性比较95%的LoA:−0.2765~0.3981,有3个点位于位于95% LoA之外,95%的一致性区间宽度为:0.6746差值均数:0.0608,其中有6.25%的点位于95%的LoA之外,一致性较差(图中SLO代表欧堡眼底图像联合AI分析)。
Figure 2. Consistency comparison of VC/D measurement between Daytona fundus image combined with AI analysis group and OCTA group
图2. 欧堡眼底图像联合AI分析与OCTA测量VC/D的一致性比较
 欧堡眼底图像联合AI分析组与OCT组测量VC/D的一致性比较95%的LoA:−0.2712~0.1838,有4个点位于位于95% LoA之外,95%的一致性区间宽度为:0.455差值均数:−0.0437,其中有8.3%的点位于95%的LoA之外,一致性较差(图中SLO代表欧堡眼底图像联合AI分析)。
Figure 3. Consistency comparison of VC/D measurement between Daytona fundus image combined with AI analysis group and OCT group
图3. 欧堡眼底图像联合AI分析组与OCT组测量VC/D的一致性比较
 OCTA组与OCT组测量VC/D的一致性比较95%的LoA:−0.1046~0.12286,有4个点位于位于95% LoA之外,95%的一致性区间宽度为:0.4816差值均数:−0.1046,其中有8.3%的点位于95%的LoA之外,一致性较差。
Figure 4. Consistency comparison of VC/D measurement between OCTA group and OCT group
图4. OCTA组与OCT组测量VC/D的一致性比较
4. 讨论
青光眼是一种慢性进展性眼病,属于全球第一大不可逆性致盲眼病,其病变特征为视神经进行性萎缩,视野损害,某些类型的青光眼早期无明显症状,直到中心视功能损害才被发现。随着青光眼由早期进展至晚期,医疗费用将增加约4倍,青光眼早期的发现和治疗可以避免大部分的视功能丧失 [7] [8]。评判青光眼视神经损害是诊断青光眼的关键指标之一,同时也为青光眼患者定性、定量追踪观察的指标之一。青光眼的早期视神经损害主要表现在上下盘沿出现凹陷变薄,VC/D的增大,定量测量VC/D参数有许多仪器设备,不同的设备测量的方法不尽相同。本研究旨在比较OCT、OCTA和欧堡眼底图相联合AI分析所测量的VC/D的差异性及一致性,观察三者之间是否可进行互相替代或参考。OCT作为一种无创、非接触性、可提供高分辨率的(4~5 um)视网膜活体组织结构成像设备 [9]。可通过光学成像及计算机检测技术对视盘进行解剖上的客观、定量测量,有助于青光眼等慢性进展性疾病的长期监测、追踪观察,判断病情是否稳定等 [10]。OCTA作为OCT技术的延伸,除了测量和量化视盘结构参数,同时可提供视盘周围血流密度等信息。并随着OCTA在青光眼领域使用频率越来越高,越来越多医生认识到黄斑区血流密度、视盘旁血流密度、神经纤维层厚度等与早期青光眼、青光眼的严重程度密切相关 [11]。欧堡免散瞳、超广角、便捷、快速,常被作为常规眼底的检查项目。近年来,人工智能(AI)在检测眼底图像异常方面显示出了巨大的前景,尤其是基于深度学习神经网络的AI [12]。深度学习神经网络系统是模拟生物学上神经元传导的原理,属于人工神经网络系统,其可以在不被明确编程的情况下学习执行任务。Rogers等人比较深度学习的AI识别眼底立体照相诊断青光眼的准确性与欧洲青光眼专家的平均水平相似 [6]。Li Z等人研究表明深度学习AI智能识别青光眼及可疑青光眼敏感性达95.6%,特异性达92%,特征曲线下面积为0.942 [13]。AI的到来有潜力以低层本提供快速、便利机会给予需要治疗的患者,更有利于缺乏青光眼专科医生的基层、青光眼的筛查等。本研究将深度学习的AI与欧堡相结合,智能分析出VC/D值。
本研究通过配对样本T检验对OCT、欧堡眼底图像联合AI及OCTA的VC/D测量值上进行两两比较发现差异有统计学差异(P < 0.05),其中OCT > 欧堡联合AI > OCTA。Nan XS等人在比较OCT与OCTA在杯盘比值测量方面差异具有统计学意义(P < 0.05),这与本研究结果相似 [14]。本研究通过Bland-Altman分析发现OCT、欧堡眼底图像联合AI及OCTA在VC/D测量值一致性较差。Chan等人在比较OCT、海德堡共焦激光眼底扫描仪(Heidelberg Retina Tomograph, HRT)、立体视神经照相测量140例高眼压症的垂直杯盘比及在5年之内发展为青光眼风险研究中发现比较3种设备测量VC/D一致性较差,其中在VC/D值上OCT组 > HRT组 > 立体照相组 [15]。Koylu MT等人对138例开角型青光眼、63例可疑青光眼和61例正常眼同时进行OCTA和非散瞳立体照相视盘检查,发现2种设备测量视盘参数一致性较差,OCTA组测量VC/D的值为(0.57 ± 0.17),非散瞳立体照相的VC/D值(0.53 ± 0.13) [16]。
根据本研究结果考虑产生差异的原因可能有:不同的设备对视盘边缘的定义不完全一致;OCTA及OCT对视盘边缘定义是解剖结构上的为Bruch膜止端,而欧堡眼底图像结合AI辨认的视盘边缘与AI学习辨认有关,欧堡所成图像是二维成像的,因此所辨认的视盘的边缘并不总是Bruch膜的边缘。有研究表明眼底照相的视盘边缘与OCT所辨认的视盘边缘并不一致 [17]。OCTA虽为OCT 设备的延伸,但两设备的扫描波长、速率、分辨率不同,软件分割算法也不同,且操作者对仪器的熟练操作程度也不同。综上所述,在临床工作中,应当意识到不同的检查设备对VC/D的测量之间存在差异,不同设备之间的VC/D值不可互换,避免因使用设备不一致而影响了对病情的诊断、评估甚至是治疗。因此应使用相对固定的仪器设备对青光眼的随诊、追踪观察进行比较。
基金项目
爱尔眼科医院集团科研基金(No.AF1906D1)。
文章引用
黄丽娜,官凡钰,段阗阗,林 晨,李 强. 比较欧堡眼底图像结合人工智能分析、OCT及OCTA对垂直杯盘比一致性分析
Comparison of the Consistency of the Vertical Cup/Disc Ratio Analyzed by Daytona Combined with Artificial Intelligence, OCT and OCTA[J]. 眼科学, 2022, 11(02): 113-120. https://doi.org/10.12677/HJO.2022.112018
参考文献
- 1. Ang, L.P. (2008) Current Understanding of the Treatment and Outcome of Acute Primary Angle-Closure Glaucoma: An Asian Perspective. Annals of the Academy of Medicine, Singapore, 37, 210-215.
- 2. Tham, Y.C., Li, X., Wong, T.Y., Quigley, H.A., Aung, T. and Cheng, C.Y. (2014) Global Prevalence of Glaucoma and Projections of Glaucoma Burden through 2040: A Systematic Review and Meta-Analysis. Ophthalmology, 121, 2081-2090.
https://doi.org/10.1016/j.ophtha.2014.05.013 - 3. Chauhan, B.C. and Burgoyne, C.F. (2013) From Clinical Examination of the Optic Disc to Clinical Assessment of the Optic Nerve Head: A Paradigm Change. American Journal of Ophthalmology, 156, 218-272.
https://doi.org/10.1016/j.ajo.2013.04.016 - 4. Hemelings, R., Elen, B., Barbosa-Breda, J., et al. (2020) Accurate Prediction of Glaucoma from Colour Fundus Images with a Convolutional Neural Network That Relies on Active and Transfer Learning. Acta Ophthalmologica, 98, e94-e100.
https://doi.org/10.1111/aos.14193 - 5. Shigueoka, L.S., Vasconcellos, J.P.C., Schimiti, R.B., et al. (2018) Automated Algorithms Combining Structure and Function Outperform General Ophthalmologists in Diagnosing Glaucoma. PLoS One, 13, e0207784.
https://doi.org/10.1371/journal.pone.0207784 - 6. Rogers, T.W., Jaccard, N., Carbonaro, F., et al. (2019) Evaluation of an AI System for the Automated Detection of Glaucoma from Stereoscopic Optic Disc Photographs: The European Optic Disc Assessment Study. Eye (Lond), 33, 1791-1797.
https://doi.org/10.1038/s41433-019-0510-3 - 7. Lee, P.P., Walt, J.G., Doyle, J.J., et al. (2006) A Multicenter, Retrospective Pilot Study of Resource Use and Costs Associated with Severity of Disease in Glaucoma. JAMA Ophthalmology, 124, 12-19.
https://doi.org/10.1001/archopht.124.1.12 - 8. Tatham, A.J., Medeiros, F.A., Zangwill, L.M. and Weinreb, R.N. (2015) Strategies to Improve Early Diagnosis in Glaucoma. Progress in Brain Research, 221, 103-133.
https://doi.org/10.1016/bs.pbr.2015.03.001 - 9. Brautaset, R., Birkeldh, U., Rosén, R., Ramsay, M.W. and Nilsson, M. (2014) Reproducibility of Disc and Macula Optical Coherence Tomography Using the Canon OCT-HS100 as Compared with the Zeiss Cirrus HD-OCT. European Journal of Ophthalmology, 24, 722-727.
https://doi.org/10.5301/ejo.5000437 - 10. Moghimi, S., Hosseini, H., Riddle, J., et al. (2012) Measurement of Optic Disc Size and Rim Area with Spectral-Domain OCT and Scanning Laser Ophthalmoscopy. Investigative Ophthalmology & Visual Science, 53, 4519-4530.
https://doi.org/10.1167/iovs.11-8362 - 11. 黄丽娜, 李强, 黄鹏, 林晨, 张志强, 段阗阗, 何芬, 曾东汇. 应用光学相干断层扫描血流成像技术分析青光眼的微循环变化[J]. 眼科学, 2021, 10(2): 94-102.
https://doi.org/10.12677/HJO.2021.102011 - 12. Gulshan, V., Peng, L., Coram, M., et al. (2016) Development and Validation of a Deep Learning Algorithm for Detection of Diabetic Retinopathy in Retinal Fundus Photographs. JAMA, 316, 2402-2410.
https://doi.org/10.1001/jama.2016.17216 - 13. Li, Z., He, Y., Keel, S., Meng, W., Chang, R.T. and He, M. (2018) Efficacy of a Deep Learning System for Detecting Glaucomatous Optic Neuropathy Based on Color Fundus Photographs. Ophthalmology, 125, 1199-1206.
https://doi.org/10.1016/j.ophtha.2018.01.023 - 14. Nan, X.S., Luo, L., Li, Y.X., et al. (2016) Correlation Annalysis of Fundus Examination with Angio-OCT and FD-OCT. Guo Yanke Zazhi (International Eye Science), 16, 1543-1547.
- 15. Chan, P.P., Chiu, V. and Wong, M.O. (2019) Variability of Vertical Cup to Disc Ratio Measurement and the Effects of Glaucoma 5-Year Risk Estimation in Untreated Ocular Hypertensive Eyes. British Journal of Ophthalmology, 103, 361-368.
https://doi.org/10.1136/bjophthalmol-2017-311841 - 16. Koylu, M.T., Yilmaz, H. and Yilmaz, A.C. (2021) The Agreement between Optical Coherence Tomography Angiography and Non-Mydriatic Retinal Camera in Estimating the Optic Nerve Head Parameters and Relations with the Peripapillary Vessel Density in Primary Open-Angle Glaucoma. Eye (Lond), 35, 959-965.
https://doi.org/10.1038/s41433-020-1006-x - 17. Reis, A.S.C., Sharpe, G.P., Yang, H., Nicolela, M.T., Burgoyne, C.F. and Chauhan, B.C. (2012) Optic Disc Margin Anatomy in Patients with Glaucoma and Normal Controls with Spectral Domain Optical Coherence Tomography. Ophthalmology, 119, 738-747.
https://doi.org/10.1016/j.ophtha.2011.09.054
NOTES
*共同第一作者。
#通讯作者。