Hans Journal of Civil Engineering
Vol.
08
No.
07
(
2019
), Article ID:
32121
,
10
pages
10.12677/HJCE.2019.87132
Approximate Characterization of Porosity Evolution in Concrete Repaired by Electrochemical Deposition
Jianmin Ding1, Wenjun Liu1, Kai Wan2, Tiemei Zhu1, Yanfei Gu3, Zhiyuan Zhu4*
1Wuxi Metro Group Co. Ltd., Wuxi Jiangsu
2Urban Rail Transit Engineering Co. Ltd. of China Railway First Group Co. Ltd., Wuxi Jiangsu
3Hongqiang Reinforcement Technology Co. Ltd., Shanghai
4Department of Civil Engineering Materials, Tongji University, Shanghai

Received: Aug. 21st, 2019; accepted: Sep. 5th, 2019; published: Sep. 12th, 2019

ABSTRACT
The process of electrochemical deposition restoration is influenced by many factors and even the restoration effect of the same batch of specimens presents a fluctuating feature. In this paper, the porous concrete specimens were used to simulate the damage specimen during the process of electrochemical deposition. To evaluate the repair effects, the porosity of all the specimens were measured. Gauss distribution, Extreme distribution and Laplace distribution were used to fit the evolution of the porosity and Bayesian Information Criterion (BIC criterion) and goodness of fit determination coefficient (R2) were used to evaluate the corresponding goodness of fit. The results showed that the porosity of the specimens decreased with the progress of the restoration process, but the restoration effect (evolution of the porosity) of the same batch of specimens presented random characteristics under the same electrochemical environment setting. The fitting degree showed that compared with the Extreme distribution and Laplace distribution, the Gauss distribution was more consistent with the probabilistic characterization of the concrete porosity evolution in the repair process.
Keywords:Electrochemical Deposition, Concrete Repair, Porosity, Gauss Distribution, Degree of Fit
混凝土电化学沉积修复孔隙率演化 及其近似表征
丁剑敏1,刘文军1,万凯2,朱铁梅1,顾燕飞3,朱志远4*
1无锡地铁集团有限公司,江苏 无锡
2中铁一局集团城市轨道交通工程有限公司,江苏 无锡
3上海宏强加固技术有限公司,上海
4同济大学土木工程材料系,上海

收稿日期:2019年8月21日;录用日期:2019年9月5日;发布日期:2019年9月12日

摘 要
电化学沉积修复过程影响因素多,同一批试件的修复效果呈现出波动性特征。本文采用多孔混凝土试件模拟损伤试件开展了电化学沉积修复试验,用测量孔隙率等手段表征其修复效果,分别使用Gauss分布、Extreme分布以及Laplace分布拟合修复过程整体超声波概率演化特征,采用贝叶斯信息准则(BIC准则)与拟合优度可决系数(R2)来评价对应拟合度,结果显示,随着修复过程推进,试件整体孔隙率呈下降趋势,但是,同一批试件,在相同的电化学环境设置下,修复效果(孔隙率演化)呈现随机性特征;拟合度评价显示,对比Extreme分布以及Laplace分布,采用Gauss分布更符合修复过程混凝土孔隙率演化的概率表征。
关键词 :电化学沉积,混凝土修复,孔隙率,Gauss分布,拟合度

Copyright © 2019 by author(s) and Hans Publishers Inc.
This work is licensed under the Creative Commons Attribution International License (CC BY).
http://creativecommons.org/licenses/by/4.0/


1. 引言
水环境下的钢筋混凝土结构裂缝修复存在施工困难、耐久性差、反复渗漏等多种技术难题,给工程带来极大的安全隐患与经济损失 [1] 。电化学沉积法作为一种颇具发展前景的水环境下既有钢筋混凝土结构修复手段,通过施加一定的弱电流,产生电解沉积作用,在混凝土结构裂缝中、表面上生长并沉积一层化合物,以此有效填充、愈合混凝土的裂缝 [2] - [9] 。但是在电沉积修复混凝土的过程中,由于混凝土的自身结构复杂性以及修复环境干扰,修复过程随机性大,需要建立基于不确定性的评价方法。
本文采用多孔混凝土模拟损伤混凝土 [10] [11] [12] ,通过电沉积修复前后的孔隙率变化来评价修复效果,并结合同一批试件修复过程孔隙率演化波动性,通过Gauss分布、Extreme分布和Laplace分布对混凝土修复过程中孔隙率变化进行近似表征,并采用贝叶斯信息准则(BIC准则)与拟合优度可决系数(R2)来评价对应拟合度,拟合度评价显示,对比Extreme分布以及Laplace分布,采用Gauss分布更符合修复过程混凝土孔隙率演化的概率表征。
2. 电化学沉积修复及其效果评价试验设计
2.1. 电化学试验设置
电化学沉积法修复钢筋混凝土裂缝的试验装置如图1。
电化学修复电解质溶液Mg(NO3)2溶液,电解质溶液浓度为0.2 mol/L。为了维持修复过程溶液浓度不变,每两周更换一次电解质溶液。电沉积修复电流为0.16 A。
其试验步骤如下:
1) 在转换箱底部放入钛板,并加上3~5 cm的垫块;修复试件放在垫块之上;
2) 将钛板和电源正极相连,将试件内部钢筋(笼)和电源阴极相连,形成闭合回路;
3) 加入已配置好的电解质溶液,打开电源开关,进行电化学沉积修复试验。
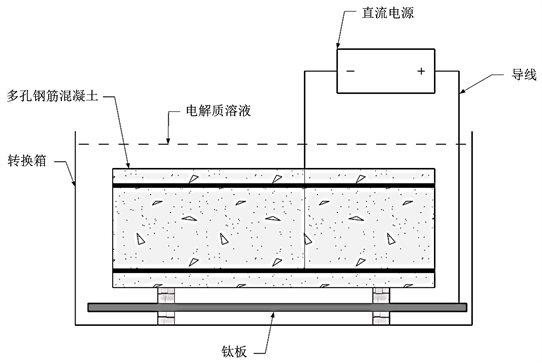
Figure 1. Electrochemical deposition restoration device
图1. 电化学沉积修复示意图
2.2. 试件制备
试验所采用的水泥为海螺牌32.5复合硅酸盐水泥。粗骨料为安山岩, 主要采用粒径为5~10 mm的碎石。细骨料粒径范围为2.5~5 mm,砂子为中砂,细度模数为2.3。
试验试件主要为多孔钢筋混凝土试件,其尺寸为10 cm × 10 cm × 30 cm。试件通过导线和钢筋笼连接,以进行电化学沉积修复反应。钢筋笼制作采用光圆钢筋,直径为8 mm。钢筋笼位于试件中部,保护层厚度为20 mm,如图2所示。
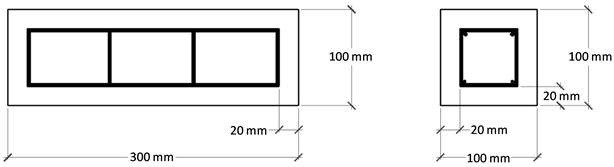
Figure 2. Steel bar distribution
图2. 钢筋笼位置示意图
多孔混凝土的材料配比参见表1。
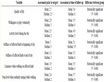
Table 1. Proportion of porous concrete materials (kg/m3)
表1. 多孔混凝土材料配合比(kg/m3)
2.3. 孔隙率测量试验原理
原则上,按照ASTM C642-06,混凝土的孔隙率可以根据下式进行计算:
(1)
式中 表示混凝土总的孔隙率, 为混凝土试件的绝对密度(absolute density), 是干体积密度(dry bulk density)。然而,绝对密度的获取是需要将试件磨成足够小的粉末,直到试件不存在不可渗透的孔隙为止。显然,采用这种方法来检测修复过程混凝土的孔隙率不便于操作。因此,文章采用阿基米德法测量修复混凝土的孔隙率,其计算公式如下:
(2)
式中 为混凝土试件经烘箱(80度)干燥24小时后的质量; 为试件的悬浮质量,即为试件全部淹没在水中的质量; 是水的密度, 是试件的体积。
3. 电化学沉积修复试验结果与分析
3.1. 修复前后试件孔隙率分布
孔隙率测量的时间为电沉积修复前,修复14天,修复35天。测量对象共14个试件。孔隙率测量通过阿基米德法测定。图3即表示试件孔隙率随修复时间的变化直方图。
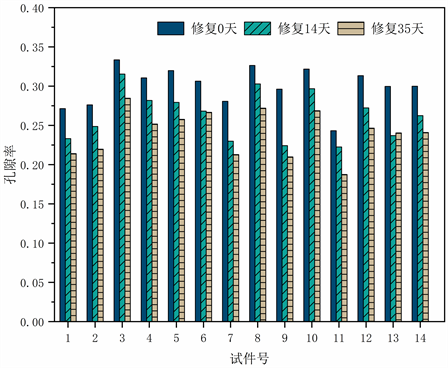
Figure 3. Porosity evolution of 13 specimens during restoration
图3. 13个试件孔隙率随时间变化
从图中可以看出,对于14个试件,经过电沉积修复后,其孔隙率均下降明显,这表明多孔混凝土试件经电沉积修复后逐渐密实;同时间同批试件的孔隙率呈无规则分布,表明混凝土自身成分的复杂性与差异性;不同试件经电沉积修复后,孔隙率下降幅度也不尽相同,无规则化,表明电沉积修复过程是一个随机过程。
分别将修复前,修复14天和修复35天后所测的多孔混凝土试件孔隙率进行平均化处理,可以得到在修复前所有试件的平均孔隙率为0.2999 (标准差为0.02584);修复14天后,平均孔隙率降为0.26245 (标准差为0.0319);修复35天后,平均孔隙率进一步降为0.24092 (标准差为0.02962)。整个修复过程试件平均孔隙率的变化如图4所示。这表明混凝土电沉积修复的有效性。
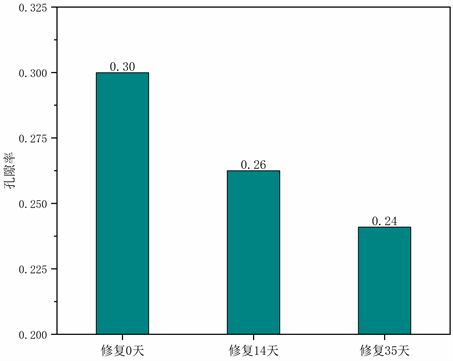
Figure 4. Average value of porosity during restoration
图4. 孔隙率平均值随时间分布图
 (1) Gauss分布
 (2) Extreme分布
 (3) Laplace分布
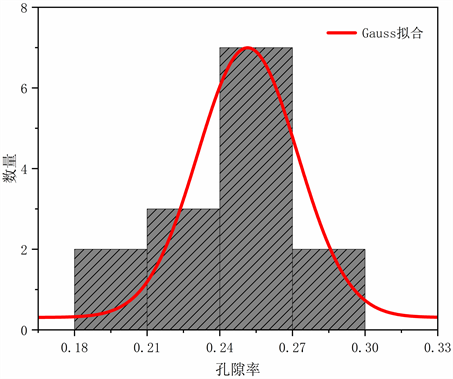
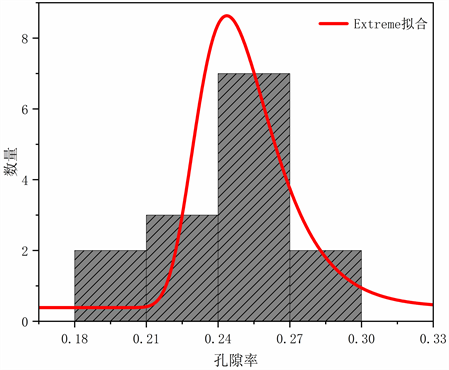
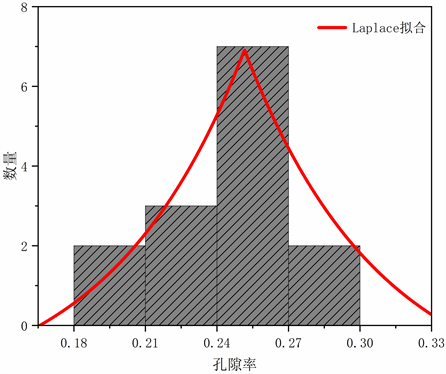
Figure 5. Fitting diagram of porosity evolution distribution function for the specimens to be repaired
图5. 待修复试件孔隙率分布函数拟合图
3.2. 修复试件孔隙率演化近似合
通过将修复0天、14天、35天的14个试件孔隙率值从0.165至0.375按0.030进行区间分布频数统计,结果发现,三组分布均呈中间高,两端逐渐下降且具有一定对称性的钟状分布。因此,可以通过对孔隙率分布频数进行曲线拟合,从而对混凝土电沉积修复过程的孔隙率演化近似表征。
根据孔隙率分布的特定形状特征,本文分别采用Gauss分布、extreme分布、Laplace分布这三种符合数据分布,且具有一定差异性的函数对数据进行非线性拟合。
以修复0天孔隙率分布函数作拟合图,如图5所示。从图中可以直观地发现三种函数拟合度都很高,为此还需要定量对拟合程度进行评价,以确定一最优函数对波速分布进行表征。
4. 孔隙率演化表征函数拟合评价
4.1. 拟合函数评价指标
为了确定上述拟合函数中的最优模型,本文将采取拟合优度可决系数R2与BIC指数对上述模型进行评价。
函数模型拟合的优劣程度评价指标主要为拟合优度与模型复杂度。
拟合优度是指回归曲线对观测值的拟合程度。度量拟合优度的统计量是可决系数R2 [13] [14] [15] 。R2等于回归平方和在总平方和中所占的比率,即回归方程所能解释的因变量变异性的百分比,公式如下:
(3)
其中, 为序列值, 为序列平均值, 为函数拟合值,TSS为执行回归分析前,序列固有的方差,RSS为残差平方和(回归模型不能解释的方差)。
的取值在0到1之间。 愈接近于1,拟合函数的残差平方和愈小,拟合优度愈高。
但是,最优拟合函数选择并非只由拟合优度决定,还有模型复杂度影响。
若假设模型1:Y = A1X1 + B;模型2:Y = A1X1+ A2X2 + B。如果在给定X1的前提下,X2对Y值有重要贡献,那么模型2肯定比1更好。但是,如果在A2等于0时,X2将对模型没有额外的贡献。把X2加进模型里来,X2会把不必要的噪音带进来,并因此影响整个模型的估计精度,预测精度。因此,考虑到模型复杂度的影响,本文引入了BIC指数对拟合函数进行评价与对比验证。
BIC准则是指在不完全情报下,对部分未知的状态用主观概率估计,然后用贝叶斯公式对发生概率进行修正,最后再利用期望值和修正概率做出最优决策 [16] 。BIC指数愈小,拟合度愈高。BIC准则公式如下:
(4)
式中n指数据数量,q指对应的模型的变量的个数,RSS指残差平方和。
相比于R2,贝叶斯公式将拟合函数评价分为拟合优度部分与拟合函数复杂度惩罚部分,惩罚力度随着模型变量数增加而增大。因此,BIC指数可以对模型复杂度有效管控。
4.2. 函数模型拟合度评价
针对Gauss分布、Extreme分布以及Laplace分布对修复0天、14天、35天的孔隙率分布的拟合模型,分别计算其R2与BIC指数并作出分布图,如图6、图7所示。
从图中可以看出,对于不同修复龄期的孔隙率分布的近似拟合中,Gauss分布的R2最接近于1,BIC指数也最小,都证明Gauss较其他两种分布更适用于拟合电沉积修复混凝土的超声波速分布。因此,可使用Gauss分布来拟合电沉积修复的混凝土试件孔隙率演化特征。
4.3. 电沉积修复混凝土超声波速表征评价分析
电沉积修复混凝土的孔隙率分布近似符合Gauss分布。因此,运用Gauss分布拟合修复混凝土的孔隙率分布可以有效的对混凝土的修复效果进行评价。本文将修复0天,14天,35天的混凝土的孔隙率分布图进行Gauss分布拟合对比,如图8。
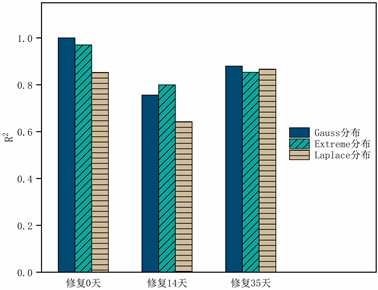
Figure 6. R2 distribution diagram
图6. R2分布图
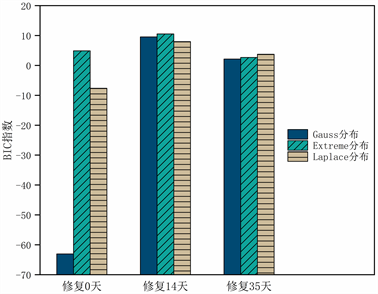
Figure 7. BIC coefficient distribution diagram
图7. BIC指数分布图
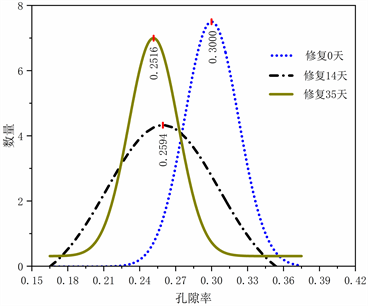
Figure 8. Gauss distribution of porosity over time
图8. 孔隙率随时间变化的Gauss分布图
图中可以看出,随着修复时间的进行,孔隙率Gauss分布图逐渐右移,整体波速逐渐增加,表征了混凝土逐渐密实的过程。波峰横坐标孔隙率变化可用来评估混凝土的修复进程。
5. 结论
电化学沉积修复过程影响因素多,同一批试件的修复效果呈现出波动性特征。本文采用多孔混凝土试件模拟损伤试件开展了电化学沉积修复试验,用测量孔隙率等手段表征其修复效果,分别使用Gauss分布、Extreme分布以及Laplace分布拟合修复过程整体孔隙率概率演化特征,采用贝叶斯信息准则(BIC准则)与拟合优度可决系数(R2)来评价对应拟合度。得到如下几点结论:
1) 孔隙率分布表明修复过程多孔混凝土试件的平均孔隙率呈下降趋势,沉积产物逐渐增多,混凝土修复过程中逐渐密实。
2) 混凝土同批次不同试件孔隙率差异较大,体现了混凝土自身的随机性;混凝土不同时间孔隙率随时间的下降幅度也各不相同,体现了电沉积修复过程的随机性。
3) 混凝土的孔隙率分布可通过经典概率密度函数回归拟合,比较Gauss分布、Extreme分布、Laplace分布,可发现Gauss分布更适用于修复混凝土的孔隙率分布。
文章引用
丁剑敏,刘文军,万 凯,朱铁梅,顾燕飞,朱志远. 混凝土电化学沉积修复孔隙率演化及其近似表征
Approximate Characterization of Porosity Evolution in Concrete Repaired by Electrochemical Deposition[J]. 土木工程, 2019, 08(07): 1133-1142. https://doi.org/10.12677/HJCE.2019.87132
参考文献
- 1. Mehta, P.K. (1997) Durability—Critical Issues for the Future. Concrete International, 19, 1-12.
- 2. Ryu, J.S. and Otsuki, N. (2005) Experimental Study on Repair of Concrete Structural Members by Electrochemical Method. Scripta Materialia, 52, 1123-1127. https://doi.org/10.1016/j.scriptamat.2005.02.001
- 3. Ryu, J.S. and Otsuki, N. (2002) Crack Closure of Reinforced Concrete by Electro Deposition Technique. Cement and Concrete Research, 32, 159-264. https://doi.org/10.1016/S0008-8846(01)00650-0
- 4. Chen, Q., Zhu, H.H., Ju, J.W., Jiang, Z.W., Yan, Z.G. and Li, H.X. (2018) Stochastic Micromechanical Predictions for the Effective Properties of Concrete Considering the In-terfacial Transition Zone Effects. International Journal of Damage Mechanics, 27, 1252-1271. https://doi.org/10.1177/1056789517728501
- 5. Chen, Q., Jiang, Z.W., Yang, Z.H., Zhu, H.H., Ju, J.W., Yan, Z.G. and Wang, Y.Q. (2017) Differential-Scheme Based Micromechanical Framework for Unsaturated Concrete Re-paired by the Electrochemical Deposition Method. Acta Mechanica, 228, 415-431. https://doi.org/10.1007/s00707-016-1710-6
- 6. Chen, Q., Jiang, Z.W., Zhu, H.H., Ju, J.W. and Yan, Z.G. (2017) Micromechanical Framework for Saturated Concrete Repaired by the Electrochemical Deposition Method with Inter-facial Transition Zone Effects. International Journal of Damage Mechanics, 26, 210-228. https://doi.org/10.1177/1056789516672163
- 7. Chen, Q., Mousavi Nezhad, M., Fisher, Q. and Zhu, H.H. (2016) Multi-Scale Approach for Modeling the Transversely Isotropic Elastic Properties of Shale Considering Mul-ti-Inclusions and Interfacial Transition Zone. International Journal of Rock Mechanics and Mining Sciences, 84, 95-104. https://doi.org/10.1016/j.ijrmms.2016.02.007
- 8. Mohankumar, G. (2005) Concrete Repair by Electrodeposition. Indian Concrete Journal, 79, 57-60.
- 9. Monteiro, P. and Ryou, J.S. (2004) Electrodeposition as a Rehabilitation Method for Concrete Materials. Canadian Journal of Civil Enginereing, 31, 776-781. https://doi.org/10.1139/l04-044
- 10. Zhu, H.H., Chen, Q., Yan, Z.G., Ju, J.W. and Zhou, S. (2014) Microme-chanical Model for Saturated Concrete Repaired by Electrochemical Deposition Method. Materials and Structures, 47, 1067-1082. https://doi.org/10.1617/s11527-013-0115-4
- 11. Jiang, Z.W., Xing, F., Sun, Z.P. and Wang, P.M. (2008) Healing Effectiveness of Cracks Rehabilitation in Reinforced Concrete Using Electrodeposition Method. Journal of Wuhan University of Technology, 23, 917-922. https://doi.org/10.1007/s11595-007-6917-x
- 12. Chen, Q., Jiang, Z.W. and Yang, Z.H. (2015) An Experimental Study on the Repair of Deteriorated Concrete by Electrochemical Deposition Method. In: Environmental Sustainability in Transportation Infrastructure, American Society of Civil Engineers, Reston, 87-94. https://doi.org/10.1061/9780784479285.008
- 13. Kewalramani, G. (2006) Concrete Compressive Strength Pre-diction Using Ultrasonic Pulse Velocity through Artificial Neural Networks. Automation in Construction, 15, 374-379. https://doi.org/10.1016/j.autcon.2005.07.003
- 14. Braun, H., et al. (1980) A Simple Method for Testing Good-ness of Fit in the Presence of Nuisance Parameters. Journal of the Royal Statistical Society, 42, 53-63. https://doi.org/10.1111/j.2517-6161.1980.tb01100.x
- 15. Larntz, K. (1978) Small-Sample Comparisons of Exact Levels for Goodness of Fit Statistics. Journal of the American Statistical Association, 73, 253-263. https://doi.org/10.1080/01621459.1978.10481567
- 16. Constantinopoulos, C., Titsias, M.K. and Likas, A. (2006) Bayesian Feature and Model Selection for Gaussian Mixture Models. IEEE Transactions on Pattern Analysis and Ma-chine Intelligence, 28, 1013-1018. https://doi.org/10.1109/TPAMI.2006.111
NOTES
*通讯作者。