Instrumentation and Equipments
Vol.
07
No.
01
(
2019
), Article ID:
28633
,
7
pages
10.12677/IaE.2019.71002
Analysis of Pressure Fluctuation Signal in Water Flow Facility Based on EMD
Huichao Shi1, Xirui Kang1, Tao Meng2, Deming Kong3
1School of Information Science and Technology, Beijing University of Chemical Technology, Beijing
2Chinese Academy of Metrology Science, Beijing
3College of Electrical Engineering, Yanshan University, Qinhuangdao Hebei

Received: Jan. 1st, 2019; accepted: Jan. 18th, 2019; published: Jan. 25th, 2019

ABSTRACT
For the measurement requirement of flow stability, which is a key performance parameter of the flow standard facility, the flow fluctuation is often calculated indirectly by measuring the pressure fluctuation and through the stable relationship between pressure and flow in the flow standard facility. The calculation results depend on the accurate measurement of pressure fluctuation in the flow standard facility. In this paper, the flow fluctuation generator is used to generate the fluctuation in the water flow standard facility, and the measured pressure signal is processed by Empirical Mode Decomposition (EMD) method. The main pressure fluctuation signal is extracted by EMD method, and the amplitude and frequency of the fluctuation signal are obtained accurately, which can help to calculate the fluctuation of flow.
Keywords:Empirical Mode Decomposition (EMD), Flow Stability, Signal Analysis
基于EMD的水流量标准装置中 压力波动信号分析
史慧超1,康希锐1,孟涛2,孔德明3
1北京化工大学信息科学与技术学院,北京
2中国计量科学研究院,北京
3燕山大学电气工程学院,河北 秦皇岛
收稿日期:2019年1月1日;录用日期:2019年1月18日;发布日期:2019年1月25日

摘 要
对于流量标准装置中流量稳定性这一关键性能参数的测量需求,通过测量流量标准装置中压力波动信号并通过流量标准装置中压力与流量的稳定关系可以间接计算流量波动大小,而计算结果取决于流量标准装置中压力波动信号的准确测量。本文利用模拟波动发生器在水流量标准装置中生成流量波动信号,通过经验模态分解(Empirical Mode Decomposition, EMD)方法对压力传感器测得的压力信号进行处理,从中抽取出主要的压力波动信号并准确获得波动信号的幅度与频率,从而为计算流量波动大小提供帮助。
关键词 :经验模态分解(EMD),流量稳定性,信号分析

Copyright © 2019 by author(s) and Hans Publishers Inc.
This work is licensed under the Creative Commons Attribution International License (CC BY).
http://creativecommons.org/licenses/by/4.0/


1. 引言
流量稳定性是流量标准装置的关键性能参数,在标定流量计时具有重要的作用 [1] [2] 。当流量标准装置处于稳定工作状态时,装置中各处流量与压力的关系处于稳定的状态 [3] ,通过测量装置中的压力波动大小可以间接获得装置中的流量波动大小 [4] ,以上流量波动测量方法对装置中高频波动的测量具有重要的意义,因为使用流量计测量装置中流量波动的方法受到流量计采样频率低的影响,无法准确测量到频率较高的流量波动。基于流量标准装置中流量与压力的关系,通过测量装置中的压力波动大小而获得流量波动的方法中,能否准确获得压力波动幅度与波动频率至关重要。
本文利用模拟波动发生器在水流量标准装置中生成流量波动信号,通过经验模态分解(Empirical Mode Decomposition, EMD)方法对测得的压力信号进行处理,从中抽取出主要的压力波动信号,并准确获得波动信号的幅度与频率,这为间接获得流量波动幅度与频率提供准确的数据。
2. 实验方法与平台
2.1. EMD方法介绍
经验模态分解(Empirical Mode Decomposition, EMD)方法的本质是将性能不好的信号分解为一组性能较好的本征模函数(IMF Intrinsic Mode Function) [5] ,具体分解过程如下 [6] 。
1) 找出原数据序列X(t)的所有极大值点和极小值点,将其用三次样条函数分别拟合为原序列的上包络线和下包络线,求上下包络线的均值为m1;2) 将原数据序列减去m1可得到一个减去低频成分的新序列,即h1 = X(t) − m1,计算h1的包络均值m11,去除该包络平均所代表的低频成分后的数据序列为h11,即h11 = h1 − m11;3)重复上述过程,这样就得到第一个本征模函数分量IMF1,它表示信号数据序列最高频率的成分;4) 用X(t)减去IMF1,得到一个去掉高频成分的新数据序列r1,并对r1再进行上述分解,得到第二个本征模函数分量IMF2;5) 如此重复直到最后一个数据序列rn不可被分解,此时,rn代表数据序列X(t)的趋势或均值。
利用模拟波动发生器在水流量标准装置中生成流量波动信号,当流量标准装置处于稳定工作状态时,装置中各处流量与压力的关系处于稳定的状态。此时,流量标准装置中压力波动处于稳定状态。通过经验模态分解(EMD)方法对压力传感器测得的压力信号进行分解处理,可以从压力信号中抽取出主要的压力波动信号。
2.2. 实验平台
本研究所做实验在中国计量科学研究院(简称NIM)流量实验室进行,实验装置为水流量标准装置,如图1所示。水流量标准装置流量范围(0.3~500) m3/h,可以对内径(65~200) mm的流量计进行校准,该实验装置的原理为静态质量法,其最佳不确定度可达0.05% (k = 2)。试验中的压力传感器测量管路中的压力值,可以直接获得压力波动信号,但是由于管路中噪声信号以及压力传感器自身噪声的干扰,压力传感器获得的水流量标准装置管路内压力信号除了包含压力波动信号外还包含大量的干扰噪声,因此直接用压力传感器难以准确获得水流量标准装置管路中的压力波动大小。为了验证EMD分解方法的可行性,本文在水流量标准装置中使用模拟波动源模拟1 Hz频率的流量波动,同时用压力传感器测量由此引起的管路中的压力波动信号。试验中压力传感器的采样频率设置为5000 Hz。
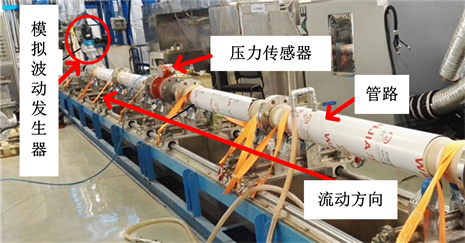
Figure 1. Schematic diagram of a test instrument and a pipe connection
图1. 测试仪器及管路图
2.3. 数据采集装置
试验中压力传感器信号由美国NI数据采集系统采集。搭建的NI数据采集系统包括主机、测试和采集板卡,其中机箱为美国NI公司研制的PXIe-1071型机箱,采集硬件则使用NI公司的PXI6341和PXI6614型高速采集板卡。数据采集系统对压力传感器信号进行实时采集,测量时压力传感器将记录的频率或模拟量信号通过数据线传递至板卡,再从板卡传送并储存在机箱中。数据采集系统通过Lab VIEW软件来进行控制,其数据采集单元的程序界面如图2所示。
3. 压力传感器输出信号分析
在水流量标准装置中,压力传感器测量由模拟波动源产生的1 Hz流量波动造成的管路中的压力波动信号,此时通过NI数据采集系统将压力传感器输出信号进行采集并存储。NI数据采集系统采集到的信号为离散信号。通过MATLAB软件根据EMD算法编写分解程序,对数据采集系统采集获得的离散信号进行分解,分解得到不同频率的主要特征分量如图3、图4、图5、图6所示。
其中按贡献率依次选出前四个特征分量分别为IMF1、IMF2、IMF3、IMF4,以上特征分量的贡献率分别为98.8987%、0.5906%、0.3010%、0.1151%。从各特征分量的贡献率可以发现IMF1为主要的特征
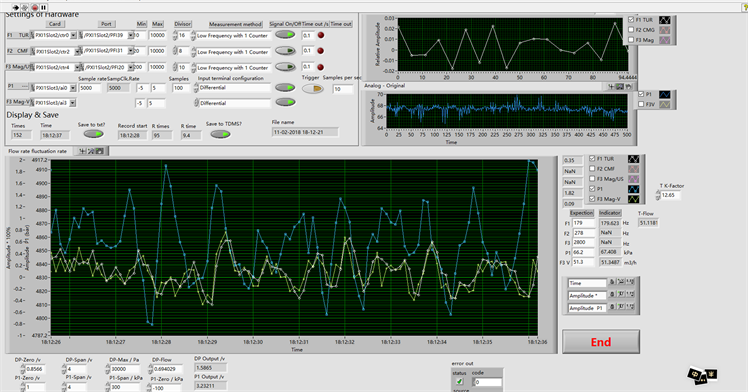
Figure 2. Interface of NI data acquisition program
图2. NI数据采集程序界面
分量,其为在水流量标准装置中模拟波动源产生的模拟波动信号。通过对以上信号进行频谱分析也可以发现IMF1分量的频率为1 Hz,这与模拟波动源产生的模拟波动信号的频率相同。通过以上分析过程可以确定,通过EMD分解得到的IMF1分量为水流量标准装置中压力波动信号。
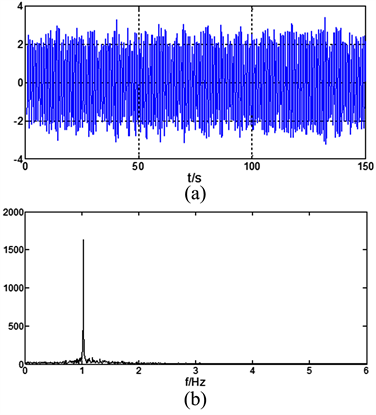
Figure 3. This figure shows the IMF1 and its frequency spectrum, (a) IMF1 from pressure sensor signal after EMD; (b) Frequency spectrum 1 from pressure sensor signal after EMD
图3. 压力波动信号的IMF1分量(a)及其频谱(b)
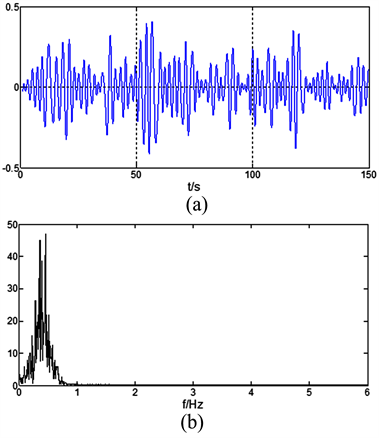
Figure 4. This figure shows the IMF2 and its frequency spectrum, (a) IMF2 from pressure sensor signal after EMD; (b) Frequency spectrum 2 from pressure sensor signal after EMD
图4. 压力波动信号的IMF2分量(a)及其频谱(b)
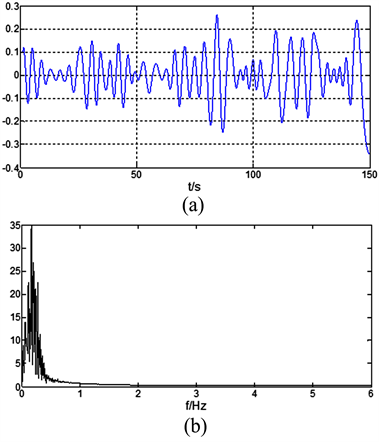
Figure 5. This figure shows the IMF3 and its frequency spectrum, (a) IMF3 from pressure sensor signal after EMD; (b) Frequency spectrum 3 from pressure sensor signal after EMD
图5. 压力波动信号的IMF3分量(a)及其频谱(b)
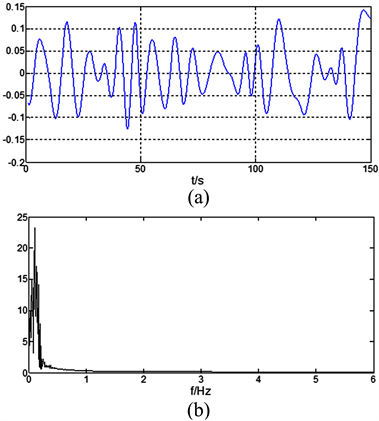
Figure 6. This figure shows the IMF4 and its frequency spectrum, (a) IMF4 from pressure sensor signal after EMD; (b) Frequency spectrum 4 from pressure sensor signal after EMD
图6. 压力波动信号的IMF4分量(a)及其频谱(b)
根据以上分析可以发现,EMD分解方法可以对压力传感器测得的压力信号进行经验模态分解处理,将水流量标准装置中模拟波动源产生的模拟流量波动引起管路内压力波动信号从压力传感器获得的信号中抽离出来,从而消除管路中噪声信号以及压力传感器自身噪声信号的影响。EMD分解方法可以准确获得水流量波动装置中主要的压力波动信号,为计算流量波动大小提供帮助。
4. 结论
本文根据测量流量标准装置中压力波动信号并通过装置中压力与流量的稳定关系间接计算流量波动大小的方法中,对于水流量标准装置中压力波动信号测量的需求,通过经验模态分解(EMD)方法将水流量标准装置中模拟波动源引起的模拟压力波动信号从压力传感器获得的压力信号中抽离出来,从而消除管路中噪声信号以及压力传感器自身噪声信号的影响。通过文中EMD方法可以准确获得波动信号的幅度与频率,为间接计算流量标准装置中流量波动大小提供准确的数据。
基金项目
本研究受到中央高校基本科研业务费专项资金资助(ZY1838)。
文章引用
史慧超,康希锐,孟 涛,孔德明. 基于EMD的水流量标准装置中压力波动信号分析
Analysis of Pressure Fluctuation Signal in Water Flow Facility Based on EMD[J]. 仪器与设备, 2019, 07(01): 8-14. https://doi.org/10.12677/IaE.2019.71002
参考文献
- 1. Engel, R. and Baade, H.J. (2014) Quantifying Impacts on the Measurement Uncertainty in Flow Calibration Arising from Dynamic Flow Effects. Flow Measurement and Instrumentation, 44, 51-60. https://doi.org/10.1016/j.flowmeasinst.2014.11.003
- 2. Berrebi, J., Deventer, J.V. and Delsing, J. (2004) Reducing the Flow Measurement Error Caused by Pulsations in Flows. Flow Measurement and Instrumentation, 15, 311-315. https://doi.org/10.1016/j.flowmeasinst.2004.05.001
- 3. Dhananchezhiyan, P. and Somashekhar Hiremath, S. (2016) Optimi-zation of Multiple Micro Pumps to Maximize the Flow Rate and Minimize the Flow Pulsation. Procedia Technology, 5, 1226-1233. https://doi.org/10.1016/j.protcy.2016.08.212
- 4. Meng, T., Fan, S., Wang, C., et al. (2018) A Flow Stability Evaluation Method Based on Flow-Pressure Correlation. Flow Measurement and Instrumentation, 64, 155-163. https://doi.org/10.1016/j.flowmeasinst.2018.10.020
- 5. Huang, N.E., et al. (1998) The Empirical Mode Decomposition and the Hilbert Spectrum for Nonlinear and Non-Stationary Time Series Analysis. Proceedings Mathematical Physical & Engineering Sciences, 454, 903-995. https://doi.org/10.1098/rspa.1998.0193
- 6. Amo, C., Santiago, L.D., Barea, R., et al. (2017) Analysis of Gamma-Band Activity from Human EEG Using Empirical Mode Decomposition. Sensors, 17, pii: E989.