Geographical Science Research
Vol.
13
No.
02
(
2024
), Article ID:
85776
,
12
pages
10.12677/gser.2024.132044
基于Biome-BGC模型的1979~2018年青藏高原生态系统总初级生产力时空变化格局研究
施翔1,廖玮杰1,尚明2,阮秀1,李世禧1,白磊1,3*
1海南大学生态与环境学院,海南 海口
2河北工程大学地球科学与工程学院,河北 邯郸
3海南省农林环境过程与生态调控重点实验室,海南 海口
收稿日期:2024年3月3日;录用日期:2024年4月22日;发布日期:2024年4月30日

摘要
在气候变化的背景下,青藏高原作为“世界屋脊”,对全球气候变化具有重要影响。研究这一地区的碳循环格局对于实现中国碳中和目标至关重要。本研究使用高分辨率的中国气象数据集驱动Biome-BGC模型,分析了1979~2018年青藏高原总初级生产力(GPP)的时空变化以及其对环境因子的响应。研究结果显示,青藏高原大部分地区的平均GPP在0至250 gC·m−2·yr−1之间,而东部部分地区GPP高达1250~1500 gC·m−2yr−1。过去40年间,青藏高原GPP整体呈现上升趋势,BGC模型模拟的最大值达到约350 gC·m−2·yr−1,与GLASS和微波遥感数据相似。不同植被类型的GPP都呈正增长趋势,其中森林的GPP最高,达974.45 gC·m−2·yr−1,沙漠最低,仅28.07 gC·m−2·yr−1。草地和灌木地随温度和降雨量上升而大幅增加GPP,达到1200 gC·m−2·yr−1左右的峰值,而裸土呈现波动模式,峰值约70 gC·m−2·yr−1。GPP的频率分布也随环境条件变化而变化。这些发现加深了我们对青藏高原GPP变化和植被对气候变化响应的理解。
关键词
土地利用,草地,森林,CMFD,GPP

Spatio-Temporal Variations Pattern Study of Gross Primary Productivity of 1979~2018 in the Qinghai-Tibet Plateau Based on the Biome-BGC Model
Xiang Shi1, Weijie Liao1, Ming Shang2, Xiu Ruan1, Shixi Li1, Lei Bai1,3*
1School of Ecology and Environment, Hainan University, Haikou Hainan
2School of Earth Science and Engineering, Hebei University of Engineering, Handan Hebei
3Key Laboratory of Agricultural and Forestry Environmental Processes and Ecological Regulation of Hainan Province, Haikou Hainan
Received: Mar. 3rd, 2024; accepted: Apr. 22nd, 2024; published: Apr. 30th, 2024

ABSTRACT
Under climate change, the Qinghai-Tibet Plateau, known as the “Roof of the World”, plays a significant role in global climatic variations. Studying its carbon cycle patterns is crucial for achieving China’s carbon neutrality goals. This research, using high-resolution Chinese meteorological datasets to drive the Biome-BGC model, analyzed the spatial and temporal variations of the total gross primary productivity (GPP) of the Qinghai-Tibet Plateau from 1979 to 2018 and its response to environmental factors. The findings revealed that the average GPP in most areas of the plateau ranged from 0 to 250 gC·m−2·yr−1, with some eastern regions reaching as high as 1250~1500 gC·m−2·yr−1. Over the past 40 years, the plateau’s GPP generally showed an increasing trend, with the BGC model simulating a maximum GPP of around 350 gC·m−2·yr−1, consistent with GLASS and microwave remote sensing data. All vegetation types exhibited a positive growth trend in GPP, with forests recording the highest (974.45 gC·m−2·yr−1) and deserts the lowest (28.07 gC·m−2·yr−1). Grasslands and shrublands showed significant GPP increases with rising temperatures and precipitation, peaking around 1200 gC·m−2·yr−1, while bare soil displayed a fluctuating pattern, peaking at approximately 70 gC·m−2·yr−1. The frequency distribution of GPP also varied with environmental conditions. These results deepen our quantitative understanding of GPP changes and vegetation responses to climate change in the Qinghai-Tibet Plateau.
Keywords:Land Use, Grassland, Forest, CMFD, GPP

Copyright © 2024 by author(s) and Hans Publishers Inc.
This work is licensed under the Creative Commons Attribution International License (CC BY 4.0).
http://creativecommons.org/licenses/by/4.0/


1. 引言
青藏高原是中国生态学研究的热点地区 [1] [2] ,该区域分布的草地生态系统是中国草地生态系统的主要组成部分 [3] [4] 。青藏高原大面积的高寒山区草地生态系统与中亚 [5] 、蒙古 [6] [7] 干旱型草地生态系统、美国 [8] [9] 中部草地生态系统和欧洲 [10] [11] 高寒山区草甸生态系统有着显著的差异,因此青藏高原高寒山区草地生态系统可以补充大尺度高寒草地生态系统的认知。草地是我国碳循环系统研究的重点生态系统类型 [12] [13] 。近年来全球气温变化显著,青藏高原温度升高相对迅速 [14] ,研究青藏高原地区GPP变化,有利于解决全球变暖的问题,加快我国实现碳中和与碳达峰的目标 [15] 。
生态系统生产力的研究一般采用实测、器测、遥感反演和生态系统过程模型模拟等方法进行。实测受制于人工采样效率,很难进行整个青藏高原生态系统的研究,仅能利用文献进行meta荟萃分析 [16] [17] [18] 。在青藏高原上仅有少数的涡度观测通量塔,而且空间分布不均匀 [19] [20] 。在青藏高原已有大量使用遥感方法研究青藏高原GPP的变化研究工作,如He等 [21] 采用MODIS和GLASS的GPP遥感产品分析青藏高原的GPP变化 [22] [23] 。遥感方法能够很好地捕捉到青藏高原GPP空间分布格局,但不同产品的GPP年均值和时间序列上的年代际变化均不同,很难衡量气候变化背景下青藏高原生态系统演变规律。
模型可以很好的补充遥感等研究方法的不足。Piao等 [24] 基于IPCC 2013年的报告提出采取模型的方法由于数据样本种类多具有不确定性。然而现有的研究在使用模型模拟所得到的结果往往空间分辨率较低、时间序列较短,对于GPP预测与分析的准确性不高 [25] ,难以满足更高精度研究的需求 [26] [27] 。Biome-BGC模型是一种可以反映生态系统内的各种成分循环过程,以及其与外界环境相互作用所产生变化的一种过程模型 [28] 。通过Forest-BGC模型发展而来的Biome-BGC可以较好地拟合青藏地区的碳格局 [29] [30] [31] 。可以模拟不同区域GPP的变化,直接反映GPP在生态系统中的时空特征 [32] 对研究青藏地区碳排放有着重要意义。但是分辨率不够,时间序列不长。
针对以上问题,本文采用Biome-BGC模型,利用高分辨率的气象数据和地理信息数据,在青藏高原进行1979~2018年0.1˚分辨率的模拟。通过研究青藏高原不同地区的GPP的变化,以及各个环境因子对GPP的影响,并对GPP变化趋势进行研究分析。
2. 研究数据与方法
青藏高原,被誉为“世界屋脊”,其多年平均温度在−6.5℃到12.9℃之间,多年平均降水量则介于50到2000毫米 [33] 。在本研究的模拟区域,共涉及25,022个格点,覆盖经度73.05˚到104.2˚,纬度26.25˚到39.95˚。如图1(a)所示该区域的平均海拔高度超过4000米,地形自西向东逐渐降低,最高点可达8000米以上。根据图1(b)数据显示,青藏高原大部分区域较为贫瘠,草地面积约160万平方公里 [34] ,其他区域包括裸地、灌木和常绿阔叶林等生态类型。

 注:本地图的审图号(GS1854(2023))。
Figure 1. (a) Topography of the Qinghai-Tibet Plateau; (b) Land use types
图1. (a) 青藏高原地形;(b) 土地利用类型
在本研究中,我们运用了Biome-BGC模型来模拟青藏高原的碳循环过程。Biome-BGC是一个综合利用气象数据和植被生理生态参数的生态系统模拟模型,能够处理从单个点到整个陆地生态系统的空间尺度。该模型在中国的草原和森林生态系统中已获得广泛验证 [35] [36] [37] 。模型输入包括日尺度气温、降水和向下短波辐射数据。本研究使用了中国科学院青藏高原研究所制作的CMFD数据集(China Meteorological Forcing Dataset, CMFD)作为气象驱动数据 [38] ,时间分辨率为3小时,空间分辨率为0.1˚,覆盖1979至2018年。这套数据已经在中国多个地区和青藏高原进行过了大量评估有较好的结果 [39] [40] 。此外,我们还使用了MODIS的IGBP土地利用分类,GTOPO30S的DEM数据(空间分辨率1 km,双线性插值至0.1˚)以及FAO的土壤数据(空间分辨率0.1˚),以此来模拟青藏高原在1979~2018年间0.1˚分辨率的GPP时空变化。
为验证Biome-BGC模型模拟结果的可靠性,本研究使用了两种方法:一是直接利用ChinaFLUX通量塔数据,二是参考相关文献数据进行验证。ChinaFLUX是一个监测碳、氮等通量的网络 [41] 。本研究选取了青藏高原上的三个通量塔(海北站、海北南、海北) 2003~2008年的数据,以此来验证Biome-BGC模型的拟合程度。此外,还通过对比其他文献中的数据与本研究的计算结果,进行了拟合分析。评估模型时,我们采用决定系数R2和均方根误差RMSE作为统计指标,其中R2用于衡量数据与观测数据和文献数据的趋势线拟合程度,而RMSE则表示数据间的平均差值。除点尺度评估外,如表1所示本研究还利用遥感数据可以较好的捕捉到GPP空间分布格局的特性 [42] ,在更大范围区域评估Biome-BGC模型模拟结果,进一步证实了其可靠性。
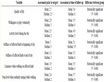
Table 1. Introduction of remote sensing GPP data
表1. 遥感GPP数据介绍
在本研究中,还研究了青藏高原上不同生态系统之间的差异和气温、降雨、向下短波辐射强度与GPP之间的关系,分析青藏高原不同生态对环境变化的响应,从而更加精确的观察GPP的变化趋势。
3. 结果
3.1. 模拟结果验证
在表2中,模型预测的GPP值与实际观察到的GPP值之间存在一定的差异。这种差异可能源于模型的不完善,或者是观察数据的误差。在一些站点,如Ali站点,模型预测的GPP值为1.39 gC·m−2·yr−1,而实际观察到的GPP值为15 gC·m−2·yr−1,差值为−13.61 gC·m−2·yr−1。这说明在这个地区,模型严重低估了生态系统的生产力。这可能是因为该地区存在特殊的地形或气候条件,导致模型无法准确预测其生产力。在阿里站,阿柔站,当雄站,大野口站,海北(南)站,海北(西)站,玛曲站,大沙龙站,改则站,温泉站站点,模型预测的GPP值高于实际观察到的值。而在纳木错站点,模型预测的GPP值低于实际观察到的值。
Table 2. Comparison of GPP and Biome-BGC model results in the literature
表2. 文献中GPP与Biome-BGC模型结果对比


 注:model为Biome-BGC模拟结果。
Figure 2. (a) Haibei shrubland; (b) Haibei wetland; (c) Damxung grassland; (d) Data observation and simulation results
图2. (a) 海北灌丛;(b) 海北湿地;(c) 当雄草地;(d) 数据观测与模拟结果
如图2(a)~(c)所示对海北灌丛、海北湿地、当雄草地三个站点的模拟数据结果进行验证。当雄草地、海北灌丛和海北湿地的R2分别是0.71、0.65、0.55;三者数据均p < 0.01可信度较高;海北灌丛、海北湿地、当雄草地三个站点均方根误差RMSE分别为0.90 gC∙d−1、1.83 gC∙d−1、2.41 gC∙d−1。误差较小模拟结果较好,模型数据可靠。
本研究选取多个学者实地测量的多个地区站点(见表2)的数据与Biome-BGC模拟结果进行分析。如图2(d)所示,通过拟合结果得出R2为0.88由此可知每对数据间的线性程度较强,RMSE = 240.98 gC∙d−1。且本文通过BGC模拟青藏地区多年GPP的变化与大多学者研究过结果阶级且p < 0.001表明置信度较好。因此本研究采取的研究方法较为准确、可信度高。
3.2. 青藏地区40年多年平均GPP空间格局及空间趋势变化
在图3(a)中,青藏高原昆仑山脉、柴达木盆地和南部某些区域的GPP主要在0到250 gC∙m−2∙yr−1范围内。而青海湖、金沙江和横断山脉等东部地区的GPP较高,大多在1000到1250 gC∙m−2∙yr−1之间,尤其是青海湖、横断山脉和四川省中部地区,GPP最高可达1250到1500 gC∙m−2∙yr−1。在图3(b)中,1979至2018年间,青藏高原大部分地区GPP呈现显著增长趋势,中部和东北部增长为0到6 gC·m−2·yr−2,南部某些地区增长高达0到30 gC·m−2·yr−2。而西北部和东南部则呈现下降趋势,约为−6到0 gC·m−2·yr−2,与Deng等的研究结果相似 [49] ,证明模拟结果的可靠性。

Figure 3. Spatial distribution maps of the multi-year mean GPP (a) and GPP change trend (b) on the Qinghai-Tibet Plateau, 1979~2018
图3. 1979~2018年青藏高原多年平均GPP (a)和GPP变化趋势 (b)的空间分布图
3.3. 基于模型与遥感数据下的青藏地区GPP变化趋势
在图4中,过去40年中,GPP整体呈上升趋势。2000年前GPP较低,但之后显著提升。1979至2018年间,BGC、GLASS和微波数据的GPP最大值均约为350 gC·m−2·yr−1,尽管出现年份不同,但变化趋势一致。EC-LUE的GPP观测数据较低,最大值约300 gC·m−2·yr−1,但变化趋势相似。1993年微波数据的GPP异常低,被排除。EC-LUE数据从1982年的211.92 gC·m−2·yr−1增至2018年的292.08 gC·m−2·yr−1,约每年增长0.28%。GLASS数据从1982年的238.41 gC·m−2·yr−1增至335.25 gC·m−2·yr−1,约每年增长0.33%。VOD数据呈现复杂趋势,但总体上升。Biome-BGC数据从1979年的289.86 gC·m−2·yr−1增至356.47 gC·m−2·yr−1,年增长率约0.23%。EC-LUE数据在1998年后增长显著,GLASS数据增长较平稳。
 注:微波数据1993年所测值异常低,因此舍去。
Figure 4. The multi-year mean GPP on the Qinghai-Tibet Plateau, 1979~2018
图4. 1979~2018年青藏高原多年平均GPP图
3.4. 不同土地利用下GPP的变化趋势
在图5中,各类土地的空间平均初级生产力(GPP)均为正值,其中森林GPP值最高(974.45 gC∙m−2∙yr−1),其次是草原(543.29 gC·m−2·yr−1),沙漠最低(28.07 gC·m−2·yr−1)。所有土地类型的GPP均呈现上升趋势,特别是森林的增长最快(2.99 gC·m−2·yr−2),而沙漠增长最慢(0.61 gC·m−2·yr−2)。草地和草甸GPP增长趋势高于灌木林,可能因CMFD数据集中降雨量和温度增加。四十年间,森林和草地GPP年际变化大,显示对气象因素敏感;灌木林地和荒漠在1995~2005年间也显著增长。这些结果揭示了气候因素与植被动态之间的复杂相互作用。


Figure 5. The multi-year mean GPP values and change trends for various vegetation types
图5. 不同植被类型的多年平均GPP值及其变化趋势
3.5. 生态因子对GPP的影响
如图6所示,不同生态系统类型的初级生产力对环境变化反应存在差异性。研究发现,当温度升高时,开阔灌木丛和草地的GPP值增加,在10℃左右时可达到1200 gC·m−2·yr−1的最高值,而裸地的GPP变化趋势较为复杂;当向下短波辐射超过200 W/m2时,开阔灌木丛和草地的GPP出现下降,裸地GPP变化不明显;随着降雨量增加,各类生态系统的GPP均出现不同程度的增长,其中草地的GPP最大可达1000 gC·m−2·yr−1。这说明不同系统对环境变化的敏感性存在差异。另外研究还发现,温度和辐射超过一定阈值,或降雨过多时,生态系统GPP与环境因子的关系变得复杂。总体而言,当环境变化较小时,GPP与温度、辐射量和降雨量保持较好的线性关系,这可用于特征化不同生态系统的韧性变化规律,评估气候变化的影响效应。


 注:第1~3列分别是与气温、向下短波辐射、降水的关系。
Figure 6. Relationship between GPP and environmental factors under different vegetation types on the Qinghai-Tibet Plateau
图6. 青藏高原不同植被类型下GPP与环境因子的关系
4. 讨论和结论
近年来,对青藏高原总初级生产力(GPP)变化的研究引起了广泛关注。该领域的研究内容多样,从具体地区(如青海湖 [50] 、Arou地区 [51] )到更广泛的空间(如全中国 [52] 、全球GPP分析 [53] )。然而,现有研究并未达成广泛一致性,对青藏地区GPP变化的理解存在差异。本研究旨在填补这一空白,通过运用Biome-BGC模型,分析了青藏高原GPP的变化及其对环境因子的响应。结果表明,模型模拟的GPP通常高于观测值,但总体上具有参考价值。同时,我们发现不同类型植被对环境因子的反应存在规律性变化,但GPP的变化受多种环境因子的影响,这些因子之间的相互作用使得GPP变化难以预测。模型存在一些问题,需要对参数进行更多测试和改进。此外,数据的空间分辨率也对研究结果有所影响。因此,对青藏地区GPP变化的研究需要更全面、精确和多元化的方法,包括改进模型、考虑更多环境因子,以及探索新的分析和计算方法,以更好地理解和预测青藏地区的环境变化。
本研究通过使用Biome-BGC模型在青藏高原1979~2018年对生态系统GPP模拟,得出如下结论:
1) 本研究使用的方法和数据具有很高的可靠性,模拟的GPP与观测数据拟合度非常好,三种区域数据的决定系数R2分别为0.71、0.65、0.55,均方根误差较小,且与模拟数据的线性拟合度极高(R2 = 0.93)。
2) 在青藏高原,大部分区域的GPP值在0~250 gC·m−2·yr−1之间,而青海湖和横断山脉等地区的GPP最高,达到1250~1500 gC·m−2·yr−1。40年间,青藏高原GPP呈增长趋势,尤其在北部地区。
3) 使用BGC模型模拟的1979~2018年间的GPP最大值约为350 gC·m−2·yr−1,与GLASS及微波数据相似,而ECLUE数据观测的GPP值略低,最大值约为300 gC·m−2·yr−1。
4) 各个植被类型的GPP均呈增长趋势。森林的GPP值最大,为889.5 gC·m−2·yr−1,增长趋势为2.99 gC·m−2·yr−1;灌木的GPP值较大,为657.6 gC·m−2·yr−1;草地GPP增长较快,为2.06 gC·m−2·yr−2;沙漠的GPP值为39.15 gC·m−2·yr−1,增长趋势为0.61 gC·m−2·yr−2。
基金项目
国家自然科学基金(批准号:32260294);海南大学科研基金项目(批准号:KYQD(ZR)-22083)。
文章引用
施 翔,廖玮杰,尚 明,阮 秀,李世禧,白 磊. 基于Biome-BGC模型的1979~2018年青藏高原生态系统总初级生产力时空变化格局研究
Spatio-Temporal Variations Pattern Study of Gross Primary Productivity of 1979~2018 in the Qinghai-Tibet Plateau Based on the Biome-BGC Model[J]. 地理科学研究, 2024, 13(02): 457-468. https://doi.org/10.12677/gser.2024.132044
参考文献
- 1. Fu, B., Ouyang, Z., Shi, P., et al. (2021) Current Condition and Protection Strategies of Qinghai-Tibet Plateau Ecological Security Barrier. Bulletin of Chinese Academy of Sciences (Chinese Version), 36, 1298-1306.
- 2. Li, S., Zhang, H., Zhou, X., et al. (2020) Enhancing Protected Areas for Biodiversity and Ecosystem Services in the Qinghai-Tibet Plateau. Ecosystem Services, 43, Article 101090. https://doi.org/10.1016/j.ecoser.2020.101090
- 3. Wu, D., Liu, D., Wang, T., et al. (2021) Carbon Turnover Times Shape Topsoil Carbon Difference between Tibetan Plateau and Arctic Tundra. Science Bulletin, 66, 1698-1704. https://doi.org/10.1016/j.scib.2021.04.019
- 4. Zhou, H., Yang, X., Zhou, C., et al. (2023) Alpine Grassland Degradation and Its Restoration in the Qinghai-Tibet Plateau. Grasses, 2, 31-46. https://doi.org/10.3390/grasses2010004
- 5. Bi, X., Chang, B., Hou, F., et al. (2021) Assessment of Spatio-Temporal Variation and Driving Mechanism of Ecological Environment Quality in the Arid Regions of Central Asia, Xinjiang. International Journal of Environmental Research and Public Health, 18, Article 7111. https://doi.org/10.3390/ijerph18137111
- 6. Nakano, T., Nemoto, M. and Shinoda, M. (2008) Environmental Controls on Photosynthetic Production and Ecosystem Respiration in Semi-Arid Grasslands of Mongolia. Agricultural and Forest Meteorology, 148, 1456-1466. https://doi.org/10.1016/j.agrformet.2008.04.011
- 7. Kang, X., Hao, Y., Li, C., et al. (2011) Modeling Impacts of Climate Change on Carbon Dynamics in a Steppe Ecosystem in Inner Mongolia, China. Journal of Soils and Sediments, 11, 562-576. https://doi.org/10.1007/s11368-011-0339-2
- 8. Zhang, L., Wylie, B., Loveland, T., et al. (2007) Evaluation and Comparison of Gross Primary Production Estimates for the Northern Great Plains Grasslands. Remote Sensing of Environment, 106, 173-189. https://doi.org/10.1016/j.rse.2006.08.012
- 9. Sims, P.L., Singh, J.S. and Lauenroth, W.K. (1978) The Structure and Function of Ten Western North American Grasslands: I. Abiotic and Vegetational Characteristics. Journal of Ecology, 66, 251-285. https://doi.org/10.2307/2259192
- 10. Erschbamer, B., Grabherr, G. and Reisigl, H. (1983) Spatial Pattern in Dry Grassland Communities of the Central Alps and Its Ecophysiological Significance. Vegetatio, 54, 143-151. https://doi.org/10.1007/BF00047102
- 11. Rognli, O.A., Pecetti, L., Kovi, M.R., et al. (2021) Grass and Legume Breeding Matching the Future Needs of European Grassland Farming. Grass and Forage Science, 76, 175-185. https://doi.org/10.1111/gfs.12535
- 12. Jin, Z., Zhuang, Q., He, J.S., et al. (2015) Net Exchanges of Methane and Carbon Dioxide on the Qinghai-Tibetan Plateau from 1979 to 2100. Environmental Research Letters, 10, Article 085007. https://doi.org/10.1088/1748-9326/10/8/085007
- 13. Li, J., Gong, J., Guldmann, J.M., et al. (2020) Carbon Dynamics in the Northeastern Qinghai-Tibetan Plateau from 1990 to 2030 Using Landsat Land Use/Cover Change Data. Remote Sensing, 12, Article 528. https://doi.org/10.3390/rs12030528
- 14. Piao, S., He, Y., Wang, X., et al. (2010) Estimation of China’s Terrestrial Ecosystem Carbon Sink: Methods, Progress and Prospects. Nature, 467, 43-51. https://doi.org/10.1038/nature09364
- 15. Chen, H., Ju, P., Zhu, Q., et al. (2022) Carbon and Nitrogen Cycling on the Qinghai-Tibetan Plateau. Nature Reviews Earth & Environment, 3, 701-716. https://doi.org/10.1038/s43017-022-00344-2
- 16. Mu, C., Abbott, B.W., Norris, A.J., et al. (2020) The Status and Stability of Permafrost Carbon on the Tibetan Plateau. Earth-Science Reviews, 211, Article 103433. https://doi.org/10.1016/j.earscirev.2020.103433
- 17. Zhang, X.Z., Shen, Z.X. and Fu, G. (2015) A Meta-Analysis of the Effects of Experimental Warming on Soil Carbon and Nitrogen Dynamics on the Tibetan Plateau. Applied Soil Ecology, 87, 32-38. https://doi.org/10.1016/j.apsoil.2014.11.012
- 18. Favre, A., Paeckert, M., Pauls, S.U., et al. (2015) The Role of the Uplift of the Qinghai-Tibetan Plateau for the Evolution of Tibetan Biotas. Biological Reviews, 90, 236-253. https://doi.org/10.1111/brv.12107
- 19. Xuanlan, Z., Junbang, W., Hui, Y., et al. (2021) The Bowen Ratio of an Alpine Grassland in Three-River Headwaters, Qinghai-Tibet Plateau, from 2001 to 2018. Journal of Resources and Ecology, 12, 305-318. https://doi.org/10.5814/j.issn.1674-764x.2021.03.001
- 20. Peng, H., Chi, J., Yao, H., et al. (2021) Methane Emissions Offset Net Carbon Dioxide Uptake From an Alpine Peatland on the Eastern Qinghai-Tibetan Plateau. Journal of Geophysical Research: Atmospheres, 126, e2021JD034671. https://doi.org/10.1029/2021JD034671
- 21. He, P., Ma, X., Meng, X., et al. (2022) Spatiotemporal Evolutionary and Mechanism Analysis of Grassland GPP in China. Ecological Indicators, 143, Article 109323. https://doi.org/10.1016/j.ecolind.2022.109323
- 22. Fu, G., Zhang, X., Zhang, Y., et al. (2013) Experimental Warming does not Enhance Gross Primary Production and Above-Ground Biomass in the Alpine Meadow of Tibet. Journal of Applied Remote Sensing, 7, Article 073505. https://doi.org/10.1117/1.JRS.7.073505
- 23. He, P., Ma, X., Han, Z., et al. (2022) Uncertainties of Gross Primary Productivity of Chinese Grasslands Based on Multi-Source Estimation. Frontiers in Environmental Science, 10, Article 928351. https://www.frontiersin.org/articles/10.3389/fenvs.2022.928351 https://doi.org/10.3389/fenvs.2022.928351
- 24. 朴世龙, 何悦, 王旭辉, 陈发虎. 中国陆地生态系统碳汇估算: 方法、进展、展望[J]. 中国科学: 地球科学, 2022, 52(6): 1010-1020.
- 25. Wang, X., Ma, M., Song, Y., et al. (2014) Coupling of a Biogeochemical Model with a Simultaneous Heat and Water Model and Its Evaluation at an Alpine Meadow Site. Environmental Earth Sciences, 72, 4085-4096. https://doi.org/10.1007/s12665-014-3300-z
- 26. Wu, C. and Wang, T. (2022) Evaluating Cumulative Drought Effect on Global Vegetation Photosynthesis Using Numerous GPP Products. Frontiers in Environmental Science, 10, Article 908875.https://www.frontiersin.org/articles/10.3389/fenvs.2022.908875 https://doi.org/10.3389/fenvs.2022.908875
- 27. Yang, R., Wang, J., Zeng, N., et al. (2022) Divergent Historical GPP Trends among State-of-the-Art Multi-Model Simulations and Satellite-Based Products. Earth System Dynamics, 13, 833-849. https://doi.org/10.5194/esd-13-833-2022
- 28. White, M.A., Thornton, P.E., Running, S.W., et al. (2000) Parameterization and Sensitivity Analysis of the BIOME-BGC Terrestrial Ecosystem Model: Net Primary Production Controls. Earth Interactions, 4, 1-85. https://doi.org/10.1175/1087-3562(2000)004<0003:PASAOT>2.0.CO;2
- 29. Running, S.W. and Gower, S.T. (1991) FOREST-BGC, A General Model of Forest Ecosystem Processes for Regional Applications. II. Dynamic Carbon Allocation and Nitrogen Budgets. Tree Physiology, 9, 147-160. https://doi.org/10.1093/treephys/9.1-2.147
- 30. Zhang, Y. and Ye, A. (2022) Uncertainty Analysis of Multiple Terrestrial Gross Primary Productivity Products. Global Ecology and Biogeography, 31, 2204-2218. https://doi.org/10.1111/geb.13578
- 31. Xiao, F., Liu, Q. and Xu, Y. (2022) Estimation of Terrestrial Net Primary Productivity in the Yellow River Basin of China Using Light Use Efficiency Model. Sustainability, 14, Article 7399. https://doi.org/10.3390/su14127399
- 32. You, Y., Wang, S., Ma, Y., et al. (2019) Improved Modeling of Gross Primary Productivity of Alpine Grasslands on the Tibetan Plateau Using the Biome-BGC Model. Remote Sensing, 11, Article 1287. https://doi.org/10.3390/rs11111287
- 33. Lu, H.L., Li, F.F., Gong, T.L., et al. (2023) Temporal Variability of Precipitation Over the Qinghai-Tibetan Plateau and Its Surrounding Areas in the Last 40 Years. International Journal of Climatology, 43, 1912-1934. https://doi.org/10.1002/joc.7953
- 34. Genxu, W., Ju, Q., Guodong, C., et al. (2002) Soil Organic Carbon Pool of Grassland Soils on the Qinghai-Tibetan Plateau and Its Global Implication. Science of the Total Environment, 291, 207-217. https://doi.org/10.1016/S0048-9697(01)01100-7
- 35. Han, Q., Luo, G., Li, C., et al. (2014) Modeling the Grazing Effect on Dry Grassland Carbon Cycling with Biome-BGC Model. Ecological Complexity, 17, 149-157. https://doi.org/10.1016/j.ecocom.2013.12.002
- 36. Lellei-Kovács, E., Barcza, Z., Hidy, D., et al. (2014) Application of Biome-BGC MuSo in Managed Grassland Ecosystems in the Euro-Mediteranean Region. FACCE MACSUR Reports, 3, 3-58.
- 37. Chen, Y. and Xiao, W. (2019) Estimation of Forest NPP and Carbon Sequestration in the Three Gorges Reservoir Area, Using the Biome-BGC Model. Forests, 10, Article 149. https://doi.org/10.3390/f10020149
- 38. Zheng, Y., Shen, R., Wang, Y., et al. (2020) Improved Estimate of Global Gross Primary Production for Reproducing Its Long-Term Variation, 1982-2017. Earth System Science Data, 12, 2725-2746. https://doi.org/10.5194/essd-12-2725-2020
- 39. 丁光旭, 郭家力, 汤正阳, 等. 多种降水再分析数据在长江流域的适用性对比[J]. 人民长江, 2022, 53(9): 72-79.https://doi.org/10.16232/j.cnki.1001-4179.2022.09.012
- 40. 李晓东. 青海湖水体对流域气候和生态环境变化的响应[D]: [博士学位论文]. 兰州: 兰州大学, 2022.https://doi.org/10.27204/d.cnki.glzhu.2022.001524
- 41. Zhu, Z., Sun, X., Wen, X., et al. (2006) Study on the Processing Method of Nighttime CO2 Eddy Covariance Flux Data in ChinaFLUX. Science in China Series D: Earth Sciences, 49, 36-46. https://doi.org/10.1007/s11430-006-8036-5
- 42. Chen, S., Sui, L., Liu, L., et al. (2022) Effect of the Partitioning of Diffuse and Direct APAR on GPP Estimation. Remote Sensing, 14, Article 57. https://doi.org/10.3390/rs14010057
- 43. Teubner, I.E., Forkel, M., Wild, B., et al. (2021) Impact of Temperature and Water Availability on Microwave-Derived Gross Primary Production. Biogeosciences, 18, 3285-3308. https://doi.org/10.5194/bg-18-3285-2021
- 44. Liu, J. and Deng, X. (2010) Progress of the Research Methodologies on the Temporal and Spatial Process of LUCC. Chinese Science Bulletin, 55, 1354-1362. https://doi.org/10.1007/s11434-009-0733-y
- 45. Ma, M., Yuan, W., Dong, J., et al. (2018) Large-Scale Estimates of Gross Primary Production on the Qinghai-Tibet Plateau Based on Remote Sensing Data. International Journal of Digital Earth, 11, 1166-1183. https://doi.org/10.1080/17538947.2017.1381192
- 46. Sun, S., Che, T., Li, H., et al. (2019) Water and Carbon Dioxide Exchange of an Alpine Meadow Ecosystem in the Northeastern Tibetan Plateau Is Energy-Limited. Agricultural and Forest Meteorology, 275, 283-295. https://doi.org/10.1016/j.agrformet.2019.06.003
- 47. 马敏娜, 袁文平. 青藏高原总初级生产力估算的模型差异[J]. 遥感技术与应用, 2017, 32(3): 406-418.
- 48. Yi, S.H., Xiang, B., Meng, B.P., et al. (2019) Modeling the Carbon Dynamics of Alpine Grassland in the Qinghai-Tibetan Plateau under Scenarios of 1.5℃ and 2℃ Global Warming. Advances in Climate Change Research, 10, 80-91. https://doi.org/10.1016/j.accre.2019.06.001
- 49. Deng, M., Meng, X., Lu, Y., et al. (2022) The Response of Vegetation to Regional Climate Change on the Tibetan Plateau Based on Remote Sensing Products and the Dynamic Global Vegetation Model. Remote Sensing, 14, Article 3337. https://doi.org/10.3390/rs14143337
- 50. Wang, Z., Cao, S., Cao, G., et al. (2021) Effects of Vegetation Phenology on Vegetation Productivity in the Qinghai Lake Basin of the Northeastern Qinghai-Tibet Plateau. Arabian Journal of Geosciences, 14, Article No. 1030. https://doi.org/10.1007/s12517-021-07440-5
- 51. Zhang, H. and Dou, R. (2020) Interannual and Seasonal Variability in Evapotranspiration of Alpine Meadow in the Qinghai-Tibetan Plateau. Arabian Journal of Geosciences, 13, Article No. 968. https://doi.org/10.1007/s12517-020-06022-1
- 52. Wu, H., Fu, C., Wu, H., et al. (2020) Plant Hydraulic Stress Strategy Improves Model Predictions of the Response of Gross Primary Productivity to Drought across China. Journal of Geophysical Research: Atmospheres, 125, e2020JD033476. https://doi.org/10.1029/2020JD033476
- 53. Zhang, Y., Xiao, X., Wu, X., et al. (2017) A Global Moderate Resolution Dataset of Gross Primary Production of Vegetation for 2000-2016. Scientific Data, 4, Article No. 170165. https://doi.org/10.1038/sdata.2017.165
NOTES
*通讯作者。