Geographical Science Research
Vol.
13
No.
01
(
2024
), Article ID:
82151
,
8
pages
10.12677/GSER.2024.131022
复杂内陆湖泊水体遥感反射率质量控制与 光学分类
史晓玲,阿娜尔
内蒙古师范大学地理科学学院,内蒙古 呼和浩特
收稿日期:2024年1月4日;录用日期:2024年2月24日;发布日期:2024年2月29日

摘要
本文以典型的草型湖泊乌梁素海为研究区,基于实测归一化遥感反射率数据集(N = 595组)构建了具有代表性的主要水类型遥感反射率的质量控制与光学分类方法。质量控制系统可以很好地识别出有问题的数据,提高数据的鲁棒性,对归一化遥感反射率光谱数据集进行k-means非监督分层聚类分析,定义了9种不同的光谱类型,发现各类间平均反射率光谱存在显著差异,大致分为四个湖泊特征:纯水体类型(1、2类,主要以水体透明度情况而定)、水下淹没类型(3~7类,与水生植被高度参数有关)、水面以上水草类型(8类)和挺水类型(9类),最后分析了遥感反射率光学类型及特征。
关键词
乌梁素海,质量控制,光学分类,遥感反射率

Quality Control and Optical Classification of Remote Sensing Reflectance of Complex Inland Lake Waters
Xiaoling Shi, Naer A
College of Geographical Science, Inner Mongolia Normal University, Hohhot Inner Mongolia
Received: Jan. 4th, 2024; accepted: Feb. 24th, 2024; published: Feb. 29th, 2024

ABSTRACT
This article takes the typical grassy lake Wulansuhai as the research area and constructs a representative quality control and optical classification method for remote sensing reflectance of major water types based on the measured normalized remote sensing reflectance dataset (N = 595 sets). The quality control system can effectively identify problematic data, improve the robustness of the data, and perform k-means unsupervised hierarchical clustering analysis on the normalized remote sensing reflectance spectral dataset. Nine different spectral categories were defined, and significant differences in average reflectance spectra were found among them, which can be roughly divided into four lake characteristics: pure water types (1 and 2 categories, mainly determined by the transparency of the water body), submerged underwater types (3~7 categories, related to the height parameters of aquatic vegetation), aquatic grass type above water surface (8 categories), and emergent types (9 categories). Finally, the optical types and characteristics of remote sensing reflectance were analyzed.
Keywords:Wulansuhai Lake, Quality Control, Optical Classification, Remote Sensing Reflectance

Copyright © 2024 by author(s) and Hans Publishers Inc.
This work is licensed under the Creative Commons Attribution International License (CC BY 4.0).
http://creativecommons.org/licenses/by/4.0/


1. 引言
草型湖泊具有多种生态系统功能,对维持生态平衡、保护物种多样性和维持农业发展具有重要作用 [1] [2] 。在草型湖泊中,植物群落结构复杂 [3] ,水域和沿岸地带生长水生植物,包括沉水植物、挺水植物、浮叶植物和藻类等 [4] 。
由于现场和卫星获取到的遥感反射率(Remote sensing reflectance, Rrs)数据存在很多不确定性。因此,在草型湖泊中进行遥感反射率产品的质量控制,获取准确的 尤为重要 [5] 。Wei等(2016)提出了一个Rrs质量控制系统,可以准确识别出“好”与“不好”Rrs光谱。该系统可应用于现场测量和MODIS等卫星获取的Rrs产品的质量控制 [6] 。Qing等(2022)基于全球海域的光谱漫衰减系数,提出了光学分类与质量控制模型(OC_QC模型),并将模型应用于(Medium Resolution Imaging Spectrometer Instrument, MERIS)和(Moderateresolution Imaging Spectroradiometer, MODIS)遥感数据 [7] 。质量控制系统具有潜在的应用价值,然而目前还没有对内陆湖泊水体遥感反射率进行相关的质量控制研究。
国际上目前已有很多基于实测和卫星遥感反射率光谱的光学分类研究 [8] 。例如Wei等(2022)利用k-means聚类将海洋、沿海和内陆水域划分为23个类别,并检验了可见光红外成像辐射计(VIIRS)产品的可用性 [9] 。此外,还有一些研究使用了机器学习 [10] 、密度分割分类 [11] 、迭代聚类ISODATA [12] [13] 和分类树 [14] 等方法对水体进行分类。
因此,本文的主要目的是:(1) 构建草型湖泊实测遥感反射率水体的质量控制与光学分类模型;(2) 分析水体光学类型及特征。
2. 方法
2.1. 水体光学类型库构建
本研究参考了wei等 [6] 的研究方法:(1) 首先对遥感反射率光谱数据集进行归一化;(2) 利用间隙法确定归一化遥感反射率光谱nRrs数据的聚类数k;(3) 其次使用kmeans聚类法进行聚类; (4) 确定乌梁素海水体类型,最后提取每种水体类型nRrs光谱在离散波段(13个波段)上的平均值、最大值、最小值作为参考光谱的质心及上下边界值,构成质量控制与光学分类的核心。
2.2. Rrs光谱质量控制
通过比较目标光谱 与对应水类型的上、下边界来计算QA得分。其中 为波长特定得分,N为总波长数。
(1)
2.3. 水体光学分类
通过波长将目标光谱 与参考光谱 进行匹配,为目标光谱分配水类型。其中 为参考光谱与目标光谱形成的夹角。
(2)
3. 数据
乌梁素海(108˚43′~108˚57′, 40˚36′~41˚03′)位于中国内蒙古自治区巴彦淖尔市,是世界上为数不多的干旱地区草型湖泊之一,具有生物多样性和生态功能,对维护黄河中上游重要的涵养、储水和调水 [15] 起着重要的作用(图1)。本研究在2015~2021年乌梁素海水域开展了14次野外调查,共获取了595组遥感反射率光谱(Rrs)数据(图2)以及每个站点所对应的水体透明度和水草高度数据,本文从高光谱库中提取了13个波长(412、443、490、510、530、560、620、665、681、705、740、783、865 nm)的遥感反射率数据,这些波长大都可以在卫星传感器中获取。
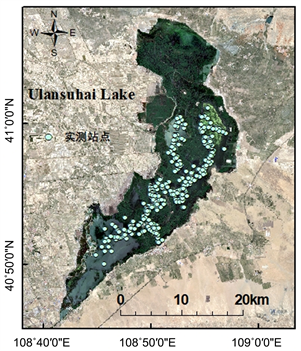
Figure 1. Location map of the research area
图1. 研究区示意图
3.1. 遥感反射率数据
本研究中使用地物光谱仪ASD Field Spec 4,采集的遥感反射率波段范围在400 nm~900 nm之间,采样间隔为1.4 nm,光谱测量采用水面以上方法 [16] 。遥感反射率(Rrs)计算公式如下:
(3)
式中, 为测量的水体辐亮度, 为天空辐亮度, 为标准版辐亮度,r为海气界面反射率, 为标准版的反射率。
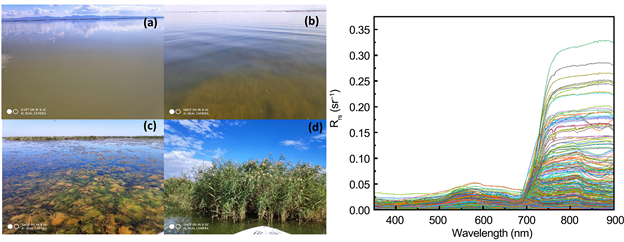
Figure 2. The left image shows the measured sampling points in Wuliangsuhai Lake including (a) water types, (b) submerged aquatic grass, (c) aquatic grass above water surface, and (d) emergent water type. The right image shows the measured remote sensing reflectance spectrum used in this study
图2. 左图为乌梁素海实测采样点(a) 水体类型、(b) 水下淹没水草、(c) 水面以上水草以及(d) 挺水类型,右图为本研究使用的实测遥感反射率光谱
3.2. 透明度及水生植被高度数据
水体透明度数据通过直径为30 cm的黑白塞氏圆盘放入水中直到磁盘不再可见来确定。水草高度由铅球标尺读取,由水平面至水草高度间的距离确定水草高度数值。水体遥感反射率在不同的透明度和不同淹没水生植被高度的影响下有不同的光谱响应 [17] 。
4. 结果
4.1. 构建水体光学类型库
对 采用间隙法确定最优聚类数,聚类簇的数量k最初设置为20,间隙曲线随着簇k数量的增加而递增,但从某个k开始上升趋势明显平缓(图3(a)),在簇数接近9的位置表明了有适当的集群数量 [18] ,因此确定最优聚类数为9。利用k-means非监督算法对 光谱进行聚类,得到9种水体光学类型和9种平均归一化中心光谱(图3(b))。
4.2. 水体光学类型及特征
根据聚类后的 结果进行监督分类,调整个别误分类结果,发现尽管这些光学水体光谱很复杂,但水体透明度以及水生植被高度对各类水体光谱有显著贡献(图4),最终确定了9种光学水体类型数据集(图5),1~2类为纯水体类型、3~8类为沉水植被类型、第9类为挺水类型,随着透明度和水生植被高度不同而呈现出不同的光谱特征。最后提取了每种聚类在13个波段上的平均值、最大值、最小值作为参考光谱的中心光谱、上下边界,为质量控制和水体光学分类模型提供参照依据,9种水体类型的平均归一化遥感反射率光谱特征(图6),各类水体光谱间存在显著差异,表1描述了水体类型主要特点。

Figure 3. (a) Gap curve, (b) K-means clustering of 9 average normalized remote sensing reflectance spectra
图3. (a) 间隙曲线,(b) K-means聚类的9种平均归一化遥感反射率光谱
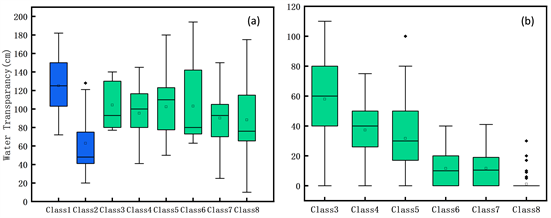
Figure 4. Water parameters of different optical water bodies (a) Height of aquatic plants in categories 1~8 (b) Transparency of water bodies in categories 3~8
图4. 不同光学水体类型水体参数 (a) 1~8类水草高度 (b) 3~8类水体透明度
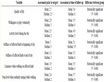
Table 1. Optical water type characteristics of grassy lakes
表1. 草型湖泊的光学水体类型主要特点
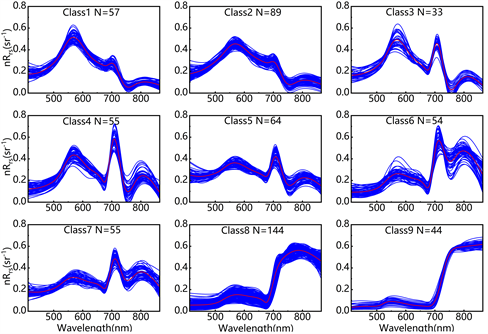
Figure 5. 9 water types were determined based on clustering of measured remote sensing reflectance. The blue line represents the normalized remote sensing reflectance spectrum, and the average remote sensing reflectance spectrum is highlighted in red. N represents the amount of data for each type
图5. 基于实测遥感反射率聚类后确定的9种水体类型,蓝色线条表示归一化后的遥感反射率光谱,平均遥感反射率光谱以红色突出显示,N为每种类型的数据量

Figure 6. Spectral characteristics of average normalized remote sensing reflectance for 9 types of water bodies
图6. 9种水体类型的平均归一化遥感反射率光谱特征
5. 讨论
基于本文的质量控制与光学分类建模使用了实测数据13个波段(412、443、490、510、530、560、620、665、681、705、740、783、865 nm)的遥感反射率值,包括大多数传感器的波段,模型是否适用于遥感应用还需评估波段完整性,考虑不同传感器的波段完整性是否影响质量控制与分类还需进一步分析,例如Sentinel-2 MSI和Landsat-8 OLI影像的波段与模型的拟合性。本文使用的光学分类方法与传统的水色指数方法(Forel-Ule Index, FUI)和Spyakos等人 [19] 的内陆水体分类方法有很大差异,FUI主要根据水体颜色及水质进行分类,由于乌梁素海为草型湖泊,因此不适用于本研究区,而内陆水体光学分类方法根据水的吸收系数和生物光学特性进行了描述。本文的研究方法更适用于复杂的草型湖泊遥感反射率光谱中。
6. 结论
本研究通过乌梁素海草型湖泊全面获取的现场测量遥感反射率光谱Rrs数据集构建了质量控制与光学分类方法,期望获取准确的遥感反射率数据,与此同时更好地了解草型湖泊水体光学类型变化,并为未来的研究提供一个框架,得到如下重要结论:
(1) 对于质量控制,如人为造成的原位测量误差、影像质量的误差等有问题的数据,质量控制系统都可以很好地识别出来。
(2) 草型湖泊的不同水体生物光学参数对光谱类型都有很大影响。如水体透明度、水草高度的不同都会影响水体反射率的呈现,这为光学分类提供了重要依据。
(3) 基于实测数据研究存在成本高、时效性差等问题,我们的遥感反射率质量控制和光学分类方法还可以应用于遥感当中,需要注意的是大气校正有关的不确定性对反射信号的影响。
基金项目
内蒙古师范大学科研创新项目“复杂内陆湖泊水体遥感反射率光学分类与质量控制(CXJJS22129)”。
文章引用
史晓玲,阿娜尔. 复杂内陆湖泊水体遥感反射率质量控制与光学分类
Quality Control and Optical Classification of Remote Sensing Reflectance of Complex Inland Lake Waters[J]. 地理科学研究, 2024, 13(01): 232-239. https://doi.org/10.12677/GSER.2024.131022
参考文献
- 1. Shi, R., Zhao, J., Shi, W., Song, S. and Wang, C. (2020) Comprehensive Assessment of Water Quality and Pollution Source Apportionment in Wuliangsuhai Lake, Inner Mongolia, China. International Journal of Environmental Research and Public Health, 17, Article 5054. https://doi.org/10.3390/ijerph17145054
- 2. Li, C., Jia, X., Zhu, R., Mei, X., Wang, D. and Zhang, X. (2023) Seasonal Spatiotemporal Changes in the NDVI and Its Driving Forces in Wuliangsu Lake Basin, Northern China from 1990 to 2020. Remote Sensing, 15, Article 2965. https://doi.org/10.3390/rs15122965
- 3. Wang, S.H., Wu, C., Xiao, D., Wang, J., Cheng, X. and Guo, F.B. (2017) Temporal Changes in Wetland Plant Communities with Decades of Cumulative Water Pollution in Two Plateau Lakes in China’s Yunnan Province. Journal of Mountain Science, 14, 1350-1357. https://doi.org/10.1007/s11629-016-4037-9
- 4. Ma, S., Wu, Y., et al. (2022) The Impact of the Accumulation of Algal Blooms on Reed Wetlands in the Littoral Zones of Chaohu Lake. Journal of Oceanology and Limnology, 40, 1750-1763. https://doi.org/10.1007/s00343-021-1258-8
- 5. Tan, Z., Zhang, B., Wu, X., Dong, M. and Cheng, L. (2022) Quality Control for Ocean Observations: From Present to Future. Science China Earth Sciences, 65, 215-233. https://doi.org/10.1007/s11430-021-9846-7
- 6. Wei, J., Lee, Z. and Shang, S. (2016) A System to Measure the Data Quality of Spectral Remote Sensing Reflectance of Aquatic Environments. Journal of Geophysical Research: Oceans, 121, 8189-8207. https://doi.org/10.1002/2016JC012126
- 7. Qing, S., Cui, T., Tang, J., Song, Q., Liu, R. and Bao, Y. (2022) An Optical Water Classification and Quality Control Model (OC_QC Model) for Spectral Diffuse Attenuation Coefficient. ISPRS Journal of Photogrammetry and Remote Sensing, 189, 255-271. https://doi.org/10.1016/j.isprsjprs.2022.05.006
- 8. Xue, K., Ma, R., Wang, D. and Shen, M. (2019) Optical Classification of the Remote Sensing Reflectance and Its Application in Deriving the Specific Phytoplankton Absorption in Optically Complex Lakes. Remote Sensing, 11, Article 184. https://doi.org/10.3390/rs11020184
- 9. Wei, J., Wang, M., et al. (2022) Global Satellite Water Classification Data Products over Oceanic, Coastal, and Inland Waters. Remote Sensing of Environment, 282, Article 113233. https://doi.org/10.1016/j.rse.2022.113233
- 10. Da Silva, E.F.F., De Moraes Novo, E.M.L., et al. (2021) A Machine Learning Approach for Monitoring Brazilian Optical Water Types Using Sentinel-2 MSI. Remote Sensing Applications: Society and Environment, 23, Article 100577. https://doi.org/10.1016/j.rsase.2021.100577
- 11. Zhou, B., Shang, M., et al. (2020) Long-Term Remote Tracking the Dynamics of Surface Water Turbidity Using a Density Peaks-Based Classification: A Case Study in the Three Gorges Reservoir, China. Ecological Indicators, 116, Article 106539. https://doi.org/10.1016/j.ecolind.2020.106539
- 12. De Lucia Lobo, F., De Moraes Novo, E.M.L., Barbosa, C.C.F. and Galvão, L.S. (2012) Reference Spectra to Classify Amazon Water Types. International Journal of Remote Sensing, 33, 3422-3442. https://doi.org/10.1080/01431161.2011.627391
- 13. Ball, G.H. and Hall, D.J. (1967) A Clustering Technique for Summarizing Multivariate Data. Behavioral Science, 12,153-155. https://doi.org/10.1002/bs.3830120210
- 14. Zhao, D., Jiang, H., Yang, T., Cai, Y., Xu, D. and An, S. (2012) Remote Sensing of Aquatic Vegetation Distribution in Taihu Lake Using an Improved Classification Tree with Modified Thresholds. Journal of Environmental Management, 95, 98-107. https://doi.org/10.1016/j.jenvman.2011.10.007
- 15. Wang, Z. and Mei, B. (2021) Current Status and Challenges of the Ecological Environment of Wuliangsuhai Basin in China. IOP Conference Series: Earth and Environmental Science, 829, Article 012012. https://doi.org/10.1088/1755-1315/829/1/012012
- 16. 唐军武, 田国良, 汪小勇, 王晓梅, 宋庆君. 水体光谱测量与分析Ⅰ: 水面以上测量法[J]. 遥感学报, 2004, 8(1): 37-44.
- 17. Liew, S.C. and Chang, C.W. (2012) Detecting Submerged Aquatic Vegetation with 8-Band WorldView-2 Satellite Images. 2012 IEEE International Geoscience and Remote Sensing Symposium, Munich, 22-27 July 2012, 2560-2562. https://doi.org/10.1109/IGARSS.2012.6350957
- 18. Tibshirani, R., Walther, G. and Hastie, T. (2001) Estimating the Number of Clusters in a Data Set via the Gap Statistic. Journal of the Royal Statistical Society Series B: Statistical Methodology, 63, 411-423. https://doi.org/10.1111/1467-9868.00293
- 19. Spyrakos, E., O’Donnell, R., et al. (2018) Optical Types of Inland and Coastal Waters: Optical Types of Inland and Coastal Waters. Limnology and Oceanography, 63, 846-870. https://doi.org/10.1002/lno.10674