Advances in Marine Sciences
Vol.1 No.02(2014), Article
ID:14572,7
pages
DOI:10.12677/AMS.2014.12009
Analysis on Multi-Scale Features of Sea Surface Salinity in Tropical Pacific Based on EEMD Method
1Institute of Meteorology & Oceanography, PLA University of Science & Technology, Nanjing
2Meteorology Station of No. 92962 Troops, Guangzhou
3Institute of Atmospheric Environment, PLA General Staff, Beijing
4Dalian Naval Academy, Dalian
Email: indo_pacific@sina.cn
Copyright © 2014 by authors and Hans Publishers Inc.
This work is licensed under the Creative Commons Attribution International License (CC BY).
http://creativecommons.org/licenses/by/4.0/


Received: Sep. 30th, 2014; revised: Oct. 20th, 2014; accepted: Nov. 3rd, 2014
ABSTRACT
The multi-scale features in west warm pool (WP), southern pacific convergence zone (SPCZ) and inter-tropical convergence zone (ITCZ) are analyzed by using the Ensemble Empirical Mode Decomposition method and lately 60-year’s sea surface salinity data. The results show that: both the sea surface salinity in the WP and SPCZ mainly show inter-annual variability, while it is dominated by annual cycle in the ITCZ. Moreover, the inter-decadal variability is relatively strong in the west warm pool but very weak in the ITCZ.
Keywords:Ensemble Empirical Mode Decomposition, Tropical Pacific, Sea Surface Salinity, Scale Analysis

基于EEMD方法的热带太平洋海表盐度多尺度特征分析
黎 鑫1,2,陈 建3,卢 扬1,郑崇伟1,4
1解放军理工大学气象海洋学院,南京
2海军92962部队气象台,广州
3解放军总参大气环境研究所,北京
4海军大连舰艇学院,大连
Email: indo_pacific@sina.cn
收稿日期:2014年9月30日;修回日期:2014年10月20日;录用日期:2014年11月3日

摘 要
基于热带太平洋近60年的格点海表盐度资料,利用集合经验模态分解方法分析了西太平洋暖池、南半球辐合带以及热带辐合带等三个区域的海表盐度多尺度变化特征,结果表明:西太平洋暖池和南半球辐合带的海表盐度以年际变化为主,而热带辐合带的海表盐度主要表现为季节变化。此外,年代际变化在西太平洋暖池区域较强,而在ITCZ区域很弱。
关键词
集合经验模态分解,热带太平洋,海表盐度,尺度分析

1. 引言
热带太平洋海表盐度在不同时间尺度的变化对于海气相互作用非常重要。除了短期的季节和年际ENSO (El Niño Southern Oscillation)变化外,热带太平洋海表盐度还有显著的年代际和长期趋势变化。
为了将不同时间尺度的海表盐度信号正确地归入环境或人为因素,并综合地考虑其季节、ENSO、年代际、长期变化各自的特征、影响及相互联系,需要对这些尺度进行分离,将自然因素和气候变化信号分离开来。
对于准周期变化,通常是用低通滤波[1] [2] 或带通滤波[3] [4] 对原始记录进行尺度分离,再对每个尺度进行统计或物理分析(如EOF)提取出季节、ENSO和年代际变化信号以衡量它们各自的幅度或重要性。在上述方法中,要特别注意其中的滤波尺度是预先设定的,而对于不稳定过程其局部时间尺度并非先验值,这就可能导致尺度混淆从而难于对每个尺度的本质属性做出正确判断。另外,趋势EOF分析[5] 、动力和热力模型[6] [7] 以及对ENSO指数进行最小二乘回归[8] 等方法也可以分离自然项。然而,这些方法在处理不稳定和非线性过程的数据时效果并不十分理想;也没有理论表明温盐变化的内在机制应该遵循某种选定的简易函数形式,如线性形式[9] 。这就导致了趋势项可能源于年代际或ENSO机制。
考虑到不同尺度信号间关系密切以及先前文献中运用的分析方法有所局限,我们需要应用一种有效的方法来分析海表盐度数据,分离其各时间尺度的变化,获取海表盐度的全面属性。而最近发展起来的集合经验模态分解方法(EEMD)在对时间序列进行尺度分离方面具有独特优势[10] -[12] 。因此,本文将基于热带太平洋近60年的格点海表盐度资料,用集合经验模态分析方法(EEMD)来分析西太平洋暖池(WP),南半球辐合带(SPCZ)和热带辐合带(ITCZ)的海表盐度多尺度变化特征。
2. 数据和方法
2.1. 研究数据
海表盐度数据使用的是[13] 制作发布的海表盐度格点产品的最新版本。产品的空间分辨率为1˚ × 1˚,时间分辨率为1个月,空间范围为热带太平洋(120˚E~70˚W, 30˚S~30˚N),时间跨度为1950~2009年。它除了给出了格点处的盐度分析值外,还给出了格点处的归一化分析误差(e),使用户可以估计分析值的可靠程度(图1)。归一化误差是指海表盐度误差方差(δS)2和相对于气候态月平均值异常的信号方差 二者间的百分比,即
 。当某格点周围没有现场数据即e = 1时,此格点的盐度值等于其气候态月平均值。
2.2. 分析方法
EEMD方法[10] 是对经验模态分解方法(EMD)的最新改进[14] 。基于时间域中数据的局部特征时间尺度,EMD可以自适应地处理非线性和不稳定的时间序列——这是分析序列表现出振幅、频率等随时间调整的特性时、EMD相对于其它分解技术如Fourier分析、小波分析等的主要优势。利用EMD,任何复杂的数据都能被分解成有限个(通常数量较小)不同频率的分量,也就是一组所谓的本征模函数(IMF)和一个残余项即趋势项,每一个IMF代表了一个简单的振荡模态并有特定的物理意义。原始的EMD遗留了一些没有解决的问题,其中之一便是模态混淆的频繁出现。模态混淆是指同一尺度的信号出现在不同的IMF中,或者一个IMF包含了多种明显不同的尺度信号。作为改进,EEMD筛选了一组加入白噪声的信号集合,将其平均值作为最终结果。在筛选过程中,有限振幅的白噪声迫使信号集合呈现出各种可能的结果,借此将不同尺度的信号整理到正确的IMF中。由于EMD是基于时空域的,在足够多次试验后,白噪声被平均掉了,而保留下来的信号被视为真实的、有物理意义的成分。利用这个集合平均,尺度能够被自然分离,而不需任何主观的先验标准,于是避免了模态混淆。EMD和EEMD方法的有效性在最近的诸多地球物理学应用中已被证明[11] [12] [15] 。
 (a)
(a) (b)
(b)
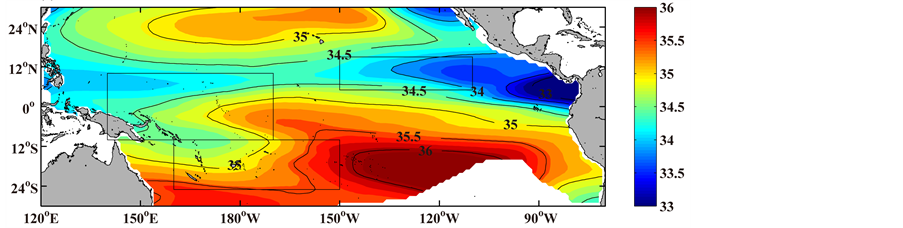
Figure 1. (a) Mean sea surface salinity in the tropical Pacific during 1950-2009. The blank mask indicates where the mean error of Sea surface salinity larger than 80%; the rectangle area of (25˚S - 10˚S, 160˚E - 150˚W; 10˚S - 10˚N, 140˚E - 170˚W; 5˚N - 15˚N, 150˚W - 110˚W) shows the range of SPCZ, WP and ITCZ, respectively; (b) Time series of the normalized area mean error of sea surface salinity in the tropical Pacific during 1950-2009
图1. (a) 热带太平洋1950~2009年的海表盐度平均场。空白区域是1970~2009年平均归一化海表盐度误差大于80%的海域;三个矩形区域(25˚S~10˚S, 160˚E~150˚W; 10˚S~10˚N, 140˚E~170˚W; 5˚N~15˚N, 150˚W~110˚W)分别指示了SPCZ, WP和ITCZ的范围;(b) 热带太平洋海域平均归一化海表盐度误差在1950~2009年间的时间序列
3. 结果分析
将每个EEMD集合成员加入的白噪声标准差设为0.4,集合成员数设为1000,对SPCZ区域平均的海表盐度时间序列进行EEMD分解,结果如图2所示。显然,原序列被自然地分解为各个周期尺度的分量。其中,C1为高频分量,C2主要为年循环信号,C3~C5主要反映了年际变化,C6~C10则代表了年代际变化,最后得到的残差项则代表了盐度的长期变化趋势。
为了得到更具物理意义的时间序列,EEMD直接分解的结果还要进行额外的再处理和重构(Qian等,2011a)。分解的第1个输出分量直接作为“再处理”的C1。按照Wu等(2008)中描述的再处理方法,可以获取简单的波形式的年循环:直接分解的第2和第3个输出分量被加在一起,然后再进行EMD筛选,再次筛选出的第1个IMF作为再处理的C2,余下的作为再处理的C3。C4~C10是直接分解得到的第4到第10个输出
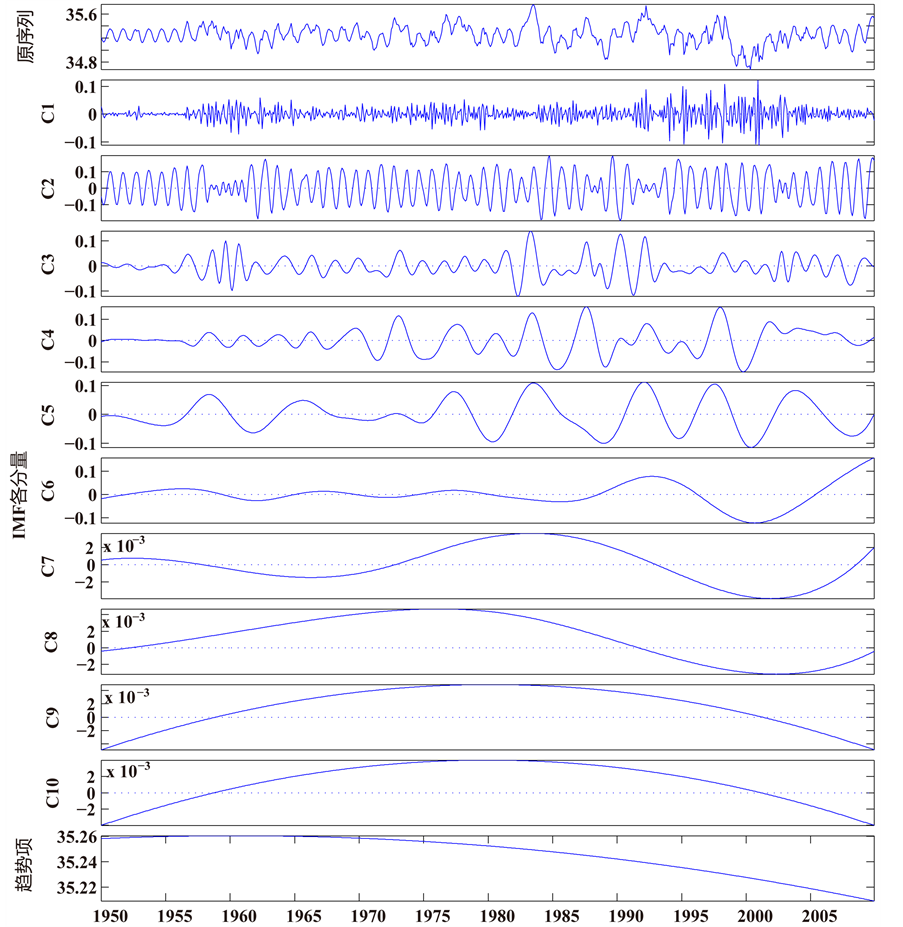
Figure 2. Time series of the area mean sea surface salinity in the SPCZ and its EEMD results
图2. SPCZ海域平均海表盐度1950~2009年间时间序列及其EEMD分解所得时间序列
分量;最后一个分量是残余项。基于每个再处理分量的平均周期(表1),图2中的再处理结果被重构为5个主要时间尺度上的分量:C1为高频分量,代表年内变化;C2为“幅调制年循环”MAC分量,代表季节变化;合并C3~C5作为ENSO分量,代表2~7年的年际变化;合并C6~C10作为年代际分量,代表年代际变化;最后的残差项作为非线性趋势项分量。以上是SPCZ时间序列的情形,采取同样处理步骤,可得到WP和ITCZ的重构结果(图4和图5)。
图3和表1的结果表明:SPCZ区域海表盐度变化主要表现为ENSO尺度的年际变化,其解释方差达到了51%,这很可能是ENSO现象引起的降水异常所致;其次,年循环信号也较强,其解释方差达到了32.3%,说明SPCZ区域的海表盐度有较强的季节变化;此外,SPCZ区域的海表盐度还有一定的年代际变化。结合图4和表1可知,WP区域盐度的变化特征与SPCZ区域比较相似,但其年代际变化明显要比SPCZ区域要强,而季节变化却明显比SPCZ要弱。对于ITCZ区域而言,其海表盐度则以季节变化为主,年际和年代际变化都很不明显(图5和表1)。显然,这种变化特征与SPCZ和WP区域有很大区别。
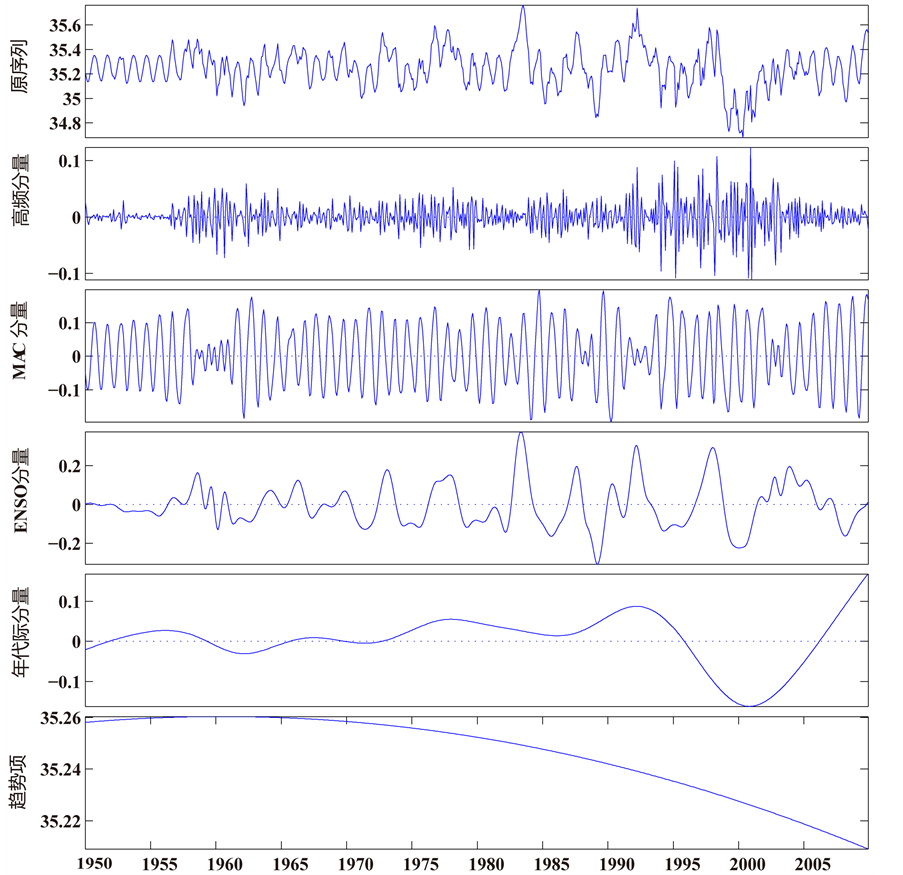
图3. 对图2中的分量进行再处理和重构得到的结果
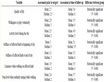
Table 1. Mean periods of reprocessed EEMD components and the percentages of variance explained by reconstructed components in the SPCZ, WP, and ITCZ
表1. SPCZ, WP和ITCZ海域再处理EEMD分量的平均周期及其重构分量的解释方差

Figure 4. Same as in Figure 3, but for WP region
图4. 同图3,但为WP区域
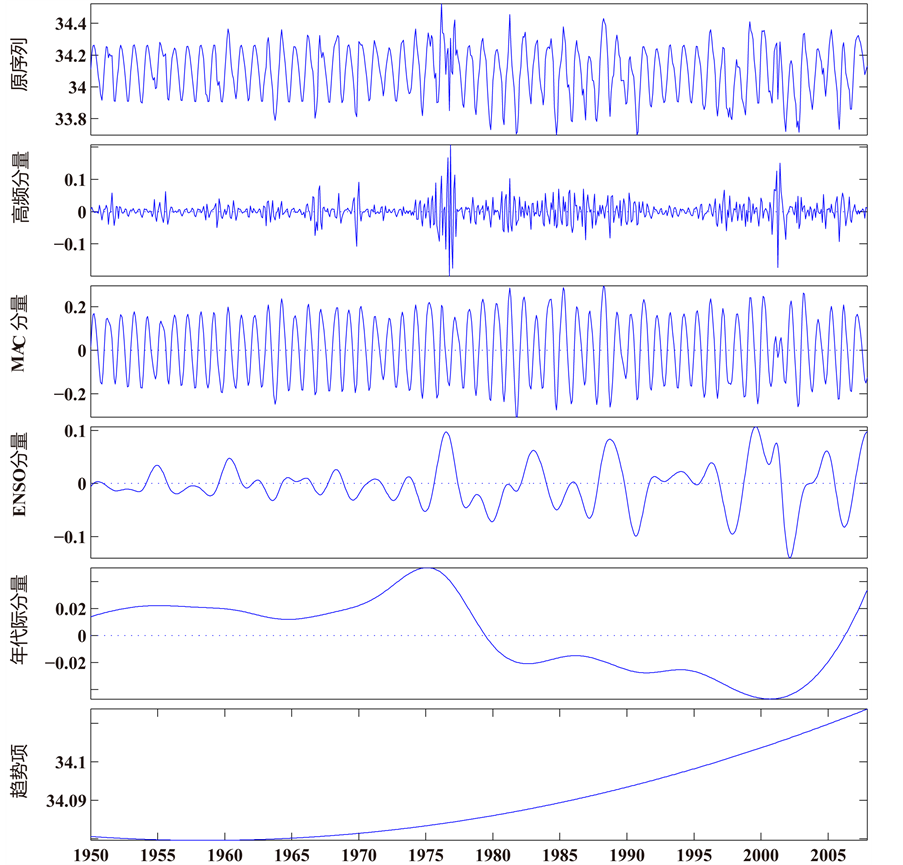
Figure 5. Same as in Figure 3, but for ITCZ region
图5. 同图3,但为ITCZ区域
4. 小结与讨论
基于一种新的时间序列分解方法,本文成功地对SPCZ、WP和ITCZ区域海表盐度的时间变化进行了尺度分离,得到了三个区域海表盐度变化的不同特征:SPCZ区域以ENSO信号引起的年际变化为主,也有明显的季节变化并有一定的年代际变化特征;WP区域虽然仍以年际变化为主,但其年代际变化要比季节变化明显;ITCZ区域则以季节变化为主导,年际和年代际变化都很弱。
另外,可以看到,SPCZ和WP区域的海表盐度自1950年来总体呈下降趋势,其中SPCZ区域下降趋势最为明显,而ITCZ区域的海表盐度则总体呈上升趋势。需特别说明的是:这里的“趋势”特指本征拟合的单调函数或在数据跨度内至多有一个极值的函数。理由是:趋势项被认为是由人类活动造成的温室气体增加引起的,应该视为排除了所有其他准周期时间尺度机制后的“(准)单调残余项”。因此,无论是包含了几个十年的年代际分量都该从趋势项中移除。例如对于SPCZ区域,C8~C10尽管周期分别为79年、84.8年和84.7年(表1),都大于数据跨度的50年,但仍被归在了年代际分量中;不过由于它们的振幅都比C6或C7小了至少一个量级,所以很难影响到年代际分量的大小。
参考文献 (References)
- [1] Gouriou, Y. and Delcroix, T. (2002) Seasonal and ENSO variations of sea surface salinity and temperature in the South Pacific Convergence Zone during 1976-2000. Journal of Geophysical Research, 107, 8011.
- [2] Delcroix, T., Cravatte, S. and McPhaden, M.J. (2007) Decadal variations and trends in tropical Pacific sea surface salinity since 1970. Journal of Geophysical Research, 112, Article ID: C03012.
- [3] Giese, B.S. and James, A.C. (1999) Interannual and decadal variability in the tropical and midlatitude Pacific Ocean. Journal of Climate, 12, 3402-3418.
- [4] Lau, K.M. and Weng, H. (1999) Interannual, decadal-interdecadal, and global warming signals in sea surface temperature during 1955-97. Journal of Climate, 12, 1257-1267.
- [5] Barbosa, S.M. and Andersen, O.B. (2009) Trend patterns in global sea surface temperature. International Journal of Climatology, 29, 2049-2055.
- [6] Thompson, D.W.J., Wallace, J.M., Jones, P.D. and Kennedy, J.J. (2009) Identifying signatures of natural climate variability in time series of global-mean surface temperature: Methodology and insights. Journal of Climate, 22, 6120- 6141.
- [7] Compo, G.P. and Sardeshmukh, P.D. (2010) Removing ENSO-related variations from the climate record. Journal of Climate, 23, 1957-1978.
- [8] Singh, A. and Delcroix, T. (2011) Estimating the effects of ENSO upon the observed freshening trends of the western tropical Pacific Ocean. Geophysical Research Letters, 38, Article ID: L21607.
- [9] Wu, Z., Huang, N.E., Long, S.R. and Peng, C.K. (2007) On the trend, detrending, and the variability of nonlinear and nonstationary time series. Proceedings of the National Academy of Sciences of the USA, 104, 14889-14894.
- [10] Wu, Z. and Huang, N.E. (2009) Ensemble empirical mode decomposition: A noise-assisted data analysis method. Advances in Adaptive Data Analysis, 1, 1-41.
- [11] Qian, C., Wu, Z., Fu, C. and Wang, D. (2011) On changing El Niño: A view from time-varying annual cycle, interannual variability, and mean state. Journal of Climate, 24, 6486-6499.
- [12] Qian, C., Wu, Z. and Yan, Z. (2011) The role of changes in the annual cycle in earlier onset of climatic spring in northern China. Advances in Atmospheric Sciences, 28, 284-296.
- [13] Delcroix, T., Alory, G., Cravatte, S., Corrège, T. and McPhaden, M. (2011) A gridded sea surface salinity data set for the tropical Pacific with sample applications (1950-2008). Deep Sea Research Part I, 58, 38-48.
- [14] Huang, N.E., Shen, Z., Long, S.R., Wu, M.C., Shih, E.H., Zheng, Q., Tung, C.C. and Liu, H.H. (1998) The empirical mode decomposition and the Hilbert spectrum for nonlinear and nonstationary time series analysis. Proceedings of the Royal Society of London, 454A, 903-995.
- [15] Qian, C., Wu, Z., Fu, C. and Zhou, T. (2010) On multi-timescale variability of temperature in China in modulated annual cycle reference frame. Advances in Atmospheric Sciences, 27, 1169-1182.