Open Journal of Nature Science
Vol.03 No.04(2015), Article ID:16348,10 pages
10.12677/OJNS.2015.34018
Recent History of Carbon and Nitrogen Accumulation Rates in Yancheng Coastal Wetland, China
Kunshan Bao1*, Guixiang Quan2, Fugang Liu3
*通讯作者。
1State Key Laboratory of Lake Science and Environment, Nanjing Institute of Geography and Limnology, Chinese Academy of Sciences, Nanjing Jiangsu
2Yancheng Institute of Technology, Yancheng Jiangsu
3Department of Geography, College of Science, Qiqihar University, Qiqihar Heilongjiang
Received: Oct. 27th, 2015; accepted: Nov. 10th, 2015; published: Nov. 16th, 2015
Copyright © 2015 by authors and Hans Publishers Inc.
This work is licensed under the Creative Commons Attribution International License (CC BY).
http://creativecommons.org/licenses/by/4.0/


ABSTRACT
Wetland ecosystems account for only 3% - 6% of the world’s land surface, but the carbon (C) stock in these systems accounts for one-third of the global terrestrial C pool, which is equivalent to 75% of the C stock in the atmosphere. Therefore, wetland ecosystems play a key role in the study of global C and nitrogen (N) cycle and climate change. Nevertheless, as an important wetland type, coastal wetlands have been scarcely studied in term of C accumulation compared to the peatlands. The main objective of this study was to evaluate the recent rate of C accumulation (RERCA) and the recent rate of N accumulation (RERNA) in two kinds of coastal wetlands in Yancheng, Jiangsu province, and estimate the inventory of C accumulation over the last 150 years. Using sediment C and N content, dry bulk density, and Pb-210 dating, we determined the accumulation rates of C and N in profiles from Yancheng coastal wetland, from Yancheng coastal wetland, and then we estimated the flux of C storage in the past 150 years. With respective to the Spartinaalterniflora flat (SAF-1) and the bare flat (BAF-1), the RERCA ranged from 116 to 165 gC∙m−2∙a−1, and the RERNA ranged from 1.68 to 3.99 gN∙m−2∙a−1. There was an obvious increasing trend for RERCA and RERNA over the last 150 years, indicating a great potential in C sequestration in the sediments. The historical inventories of C and N were 17.4 - 24.8 kgC∙m−2 and 0.25 - 0.59 kgN∙m−2, respectively. The accumulation rates of C and N were directly related. The results would be helpful in evaluating the C and N accumulation history and sequestration potential in coastal wetland and understanding the feedback effects of the Yancheng coastal wetland under climate change and anthropogenic influence.
Keywords:Carbon Accumulation, Nitrogen Accumulation, Coastal Wetland

盐城滨海湿地近现代碳、氮累积历史
鲍锟山1*,全桂香2,刘复刚3
1中国科学院南京地理与湖泊研究所湖泊与环境国家重点实验室,江苏 南京
2盐城工学院环境学院,江苏 盐城
3齐齐哈尔大学理学院地理系,黑龙江 齐齐哈尔

收稿日期:2015年10月27日;录用日期:2015年11月10日;发布日期:2015年11月16日

摘 要
湿地生态系统仅占全球陆地面积的3%~6%,但其碳储量占全球陆地碳库的1/3,相当于大气中碳含量的75%。因此,湿地生态系统在全球碳、氮循环和气候变化研究中起着重要作用。然而,作为一种重要的湿地类型,滨海湿地碳累积变化远没有泥炭地研究广泛。本研究的主要目的是评估江苏盐城滨海湿地近现代碳、氮累积速率变化历史,并估算近150年来盐城湿地碳累积通量。利用210Pb放射性测年方法,结合沉积物干容重、碳和氮含量等基本理化参数,计算近现代碳累积速率(RERCA)和近现代氮累积速率(RERNA),进而估算近150年来碳储存通量。互花米草滩地和光滩沉积柱芯(SAF-1和BAF-1)的平均RERCA分别是165 gC∙m−2∙a−1和116 gC∙m−2∙a−1,平均RERNA分别是3.99 gN∙m−2∙a−1和1.68 gN∙m−2∙a−1。近150年来,RERCA和RERNA随着时间不断增加,展现出极强的固碳潜力。盐城湿地过去150年来的碳、氮累积通量被估算为17.4~24.8 kgC∙m−2和0.25~0.59 kgN∙m−2。RERCA和RERNA之间有着显著的相关关系。本研究将有助于对滨海湿地碳、氮累积历史和潜力变化的评估,也能增进对在当前气候变化和人类活动双重影响下盐城滨海湿地的相应反馈作用的理解。
关键词 :碳累积,氮累积,滨海湿地

1. 引言
固碳是湿地生态系统一项重要的服务功能,湿地的固碳潜力要高于其他类型的生态系统[1] 。处于陆地和海洋的过渡地带的滨海湿地,是一种非常重要而又十分脆弱的湿地生态系统,它受到人类活动、海洋活动、生物活动以及地质作用的相互影响,其碳源/汇功能一直是科学界普遍关注的热点问题。未来气候变化是人类面临的重大挑战之一,很多研究都致力于在温室气体释放前提下构建新型的气候变化模型。理解和定量地球系统过程是探究未来气候变化的重要前提,这是因为很多过程都对气候变化提供着反馈机制,而全球碳循环是一个重要的影响因子,尤其是陆地生态系统的碳循环[2] 。气候模型需要包含所有主要的地球碳库模块,以完善全球碳循环模拟。但是当前的模型没有考虑海陆过渡带对气候变化的响应,而滨海湿地含有大量的碳,受人类活动和气候变化直接或间接的影响较大,比如大型水利工程的建设、大量滩涂被开垦为农田,以及气候变暖导致湿地变干、退化等,这些活动导致滨海湿地在区域碳循环中的作用发生变化[3] 。因而探索滨海湿地碳累积和碳循环规律,不仅有助于构建和完善气候变化模型,还有助于理解湿地对气候变化和人类活动双重胁迫下的响应方式。
全球已经广泛开展了不同时间尺度的泥炭地碳累积估算与评价工作,如北美[4] [5] ,欧洲[6] [7] ,南亚[8] [9] 和中国[10] -[14] 。但是,滨海湿地的碳累积研究非常有限。滨海湿地由于其自身的特点,在植物生长、促淤造陆等生态过程中积累了大量的无机碳和有机碳,它也具有很高的固碳能力[15]
。全球滨海湿地的分布面积大约为203 × 103 km2,而滨海湿地的碳累积速率为210 ±
20 g C∙m−2∙a−1,每年碳的固定量为42.6 ± 4.0 Tg C [16] 。滨海湿地中大量存在的 离子阻碍了甲烷的产生量,从而降低了甲烷的排放量,这种高的碳积累速率和低的甲烷排放量,使滨海湿地对大气温室效应的抑制作用更加明显[17]
。由此可见,滨海湿地碳储藏量和固碳潜力巨大,对湿地生态系统的碳汇功能亦有不可忽视的作用,特别是在当今全球气候变暖的大背景下,滨海湿地碳累积速率变化及对气候变化的响应方式值得深入研究。
离子阻碍了甲烷的产生量,从而降低了甲烷的排放量,这种高的碳积累速率和低的甲烷排放量,使滨海湿地对大气温室效应的抑制作用更加明显[17]
。由此可见,滨海湿地碳储藏量和固碳潜力巨大,对湿地生态系统的碳汇功能亦有不可忽视的作用,特别是在当今全球气候变暖的大背景下,滨海湿地碳累积速率变化及对气候变化的响应方式值得深入研究。
本研究以江苏省盐城滨海湿地为研究对象,通过对210Pb和137Cs定年后的沉积柱芯中碳、氮含量进行测试,研究近百年来碳、氮累积速率的时间变化规律,进而初步估算盐城滨海湿地的固碳潜力。研究结果对于全球碳循环和滨海湿地对气候变化和人类活动影响的响应研究具有重要意义。
2. 材料与方法
2.1. 研究区概况及采样
盐城湿地珍禽国家级自然保护区位于江苏省北部,是我国最大的沿海滩涂湿地类型的自然保护区。盐城滨海湿地总面积达4530 km2,相当于30%的盐城市域,占全国滩涂面积的14.3%。该地区属于北亚热带气候向南暖温带过渡的典型季风气候区,年平均气温13.8℃,年降水量达1000 mm,无霜期220 d,日光辐射总量487~508 kJ∙cm−2。江苏盐城滨海湿地是全国,乃至全球连片面积最大、生态类型最全的典型海岸潮滩带,然而当前面临严重的人为开发、工业污染、海平面上升和海岸蚀退等问题,已引起学术界的广泛关注[18] 。样品采集于盐城市射阳县射阳港区,离保护区核心区新洋港较近(约15 km)。当前该湿地植被演替层次明显,从海边向陆地方向过渡类型依次为:光滩(无植被生长,潮涨被淹没,潮落则出露),米草-碱蓬滩(互花米草带为主,潮涨时处于淹水状态)和茅草-芦苇滩(长期处于未淹水状态,靠近农田)。2013年10月,我们使用汽油泵冲击钻(Eijkelkamp,荷兰)在射阳港湿地光滩区(BAF-1,N 33˚44'37,E 120˚31'50,海拔1 m)和互花米草区(SAF-1,N 33˚46'34,E 120˚31'49,海拔3 m)采集柱芯样品。岩芯BAF-1取芯长60 cm,表层没有发育土壤层;SAF-1取芯长83 cm,表层约2 cm厚活根层被去掉了(图1)。柱芯装在PVC管里密封后,带回实验室。在实验室冷库里冷冻3 h后,取出,使用机床锯剖开样管,一半使用保鲜膜密封后放回冷库保存,另一半按照1 cm间距进行分样,每个层样装入编号的自封袋中,置于冰箱保存备用。
2.2. 实验室分析测试
2.2.1. 基本理化指标
将一定体积的样品置于冷冻干燥机下干燥12 h至恒重,冻干前后质量差除以湿样质量得到沉积物的含水量(%),干样质量除以容器体积得到沉积物的干容重(g∙cm−3)。
2.2.2. 总碳(TC)和总氮(TN)
采用元素分析仪(FlashEA 1112, ThermoFinnigan)测定碳、氮含量,本项实验在中国科学院东北地理与农业生态研究所分析测试部完成。冷冻干燥后的样品用玛瑙研钵研磨,过80目筛,用百万分之一天平称取12~13 mg,置于锡铂中,封口,放进自动进样转盘中测定总碳(TC)和总氮(TN)。测试中每10个样品放置1个国家土壤成分分析标准物质(GSS-1)进行标定和校对。
2.2.3. 放射性年代测定(210Pb和137Cs)
在中国科学院南京地理与湖泊研究所湖泊与环境国家重点实验室进行210Pb和137Cs分析。分析样品
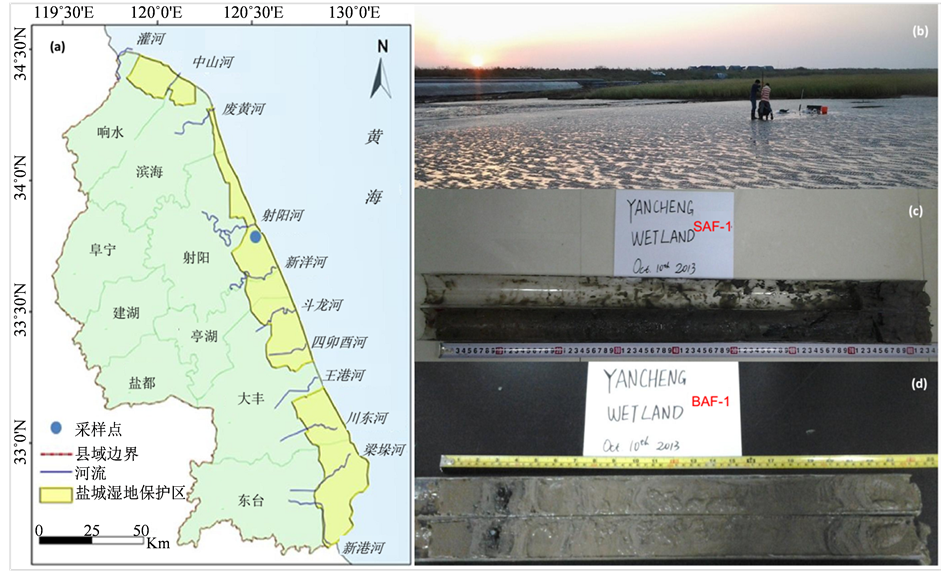
Figure 1. Study area and sampling. (a) Yancheng city map and sampling site; (b) field work; (c) and (d) sample slice in the laboratory
图1. 研究区域及采样情况。(a)盐城市地图和采样点;(b)野外采样;(c)和(d)为室内分样
为2~5 g研磨至过80目孔筛的冷冻干燥样品。210Pb和137Cs放射性比活度由美国EG&GOrtec公司生产的高纯锗井型探测器(OrtecHPGe GWL)与Ortec919型谱控制器和IBM微机构成的16K道多道分析器所组成的γ谱分析系统测定。210Pb标准样品由英国利物浦大学做比对标准;137Cs和226Ra标准样品由中国原子能研究院提供。
2.3. 数据处理及计算
根据210Pb恒定放射性通量模式(CRS)可以得出沉积物任一层的沉积年龄和沉积速率[10] 。沉积物某一层的沉积年龄通过公式(1)计算得出。沉积物孔隙度是用比重和容重计算求得,沉积物比重采用平均土壤比重2.7 g∙cm−3 (公式(2))。基于年代框架、干容重和沉积物样品中碳、氮含量计算其累积速率(公式(3),(4))。采用Microsoft Excel 2007和SPSS16.0对数据进行处理和绘图,计算平均值及标准差,进行线性回归分析。
 (1)
(1)
 (2)
(2)
 (3)
(3)
 (4)
(4)
其中,Tz为一定深度Z (cm)的沉积物沉积年龄(a),Itot为沉积物岩芯中过剩210Pb总累积输入量(Bq∙cm−2),Iz为一定深度Z (cm)以上各层沉积物岩芯中过剩210Pb总累积输入量(Bq∙cm−2),λ为210Pb放射性衰变常数(0.0311 a−1),SP为沉积物孔隙度,RERCA (gC∙m−2∙a−1)和RERNA (g N∙m−2∙a−1)为近现代碳、氮累积速率,DBD为对应深度层沉积物干容重,TC和TN为沉积物中碳、氮含量,100为单位转换系数。
3. 结果与讨论
3.1. 含水量、干容重和孔隙度
两个沉积柱芯(SAF-1和BAF-1)的含水量变化范围是20%~40%。这两个剖面含水量与以前报道的数据一致,光滩区沉积物含水量平均30%,互花米草区沉积物含水量平均约40% [19] 。二者的深度变化特征相似,最大值出现在亚表层(10 cm左右层次),随着深度往下逐渐减小,底层含水量最低(图2)。两个含水量深度剖面都表现出峰谷波动韵律,反映出海平面变化和潮汐涨落对沿海沉积过程的影响。SAF-1的干容重变化幅度为0.75~1.45 g∙cm−3,BAF-1的干容重变化范围是1.07~1.52 g∙cm−3。前者沿着深度往下表现出明显的增加趋势(图2)。在20 cm以下层次,两个剖面的干容重变化态势相似,但是对于表层样品,SAF-1干容重明显低于BAF-1,这主要是因为在互花米草滩(SAF-1),植物残体对沉积物累积贡献大。根据干容重计算得到的沉积物孔隙度表现出与干容重相反的变化趋势,上层比下层孔隙度大,沉积物比较松软(图2)。计算的沉积物的孔隙度小于前人的经验范围(0.74~0.85) [20] 。
3.2. 210Pb和137Cs放射性定年
两个沉积柱芯(SAF-1和BAF-1)的210Pb放射性测试结果如图3所示。过剩210Pb放射性比活度随着深度降低而逐渐减小,表现出典型的对数递减模式,在柱芯底部达到平衡。通过恒定放射性通量模式(CRS),计算出两个剖面的沉积年龄,并建立深度-年代框架(图3)。SAF-1剖面沉积历史约为150年,BAF-1剖面沉积历史约为125年。两个柱芯的137Cs比活度都非常低,对于SAF-1,最大137Cs比活度出现在20 cm处,只有1.22 Bq∙kg−1;对于BAF-1,最大137Cs比活度出现在46 cm处,只有1.72 Bq∙kg−1,绝大部分层次样品都没有检测到137Cs。在这两个细砂和泥砂混合的滨海沉积剖面中,137Cs记录都没有很好的保存下来,因此不能利用137Cs作为时标矫正210Pb年代。依据210Pb年代,计算出SAF-1的平均沉积速率为1.28 cm∙a−1,BAF-1的平均沉积速率为0.93 cm∙a−1。两个剖面的平均沉积通量平均为0.55 g∙cm−2∙a−1,变化范围是0.24~0.84 g∙cm−2∙a−1。距离我们研究区15 km的新洋港湿地,沉积速率约为1.2 cm∙a−1 [21] ,距离我们研究区75 km的王港湿地,沉积速率约为3.0 cm∙a−1 [22] 。射阳港湿地的沉积速率与新洋港较为一致,略小于王港湿地。
3.3. 总碳、总氮和碳氮比(C/N)
沉积柱芯SAF-1总碳含量平均为28.2 g∙kg−1,最大为37.9 g∙kg−1;BAF-1剖面总碳含量平均为20.8 g∙kg−1,最大为32.2 g∙kg−1。SAF-1总氮的平均含量为0.7 g∙kg−1,最大为1.4 g∙kg−1;BAF-1剖面总氮平均为0.3 g∙kg−1,最大为0.6 g∙kg−1。两个剖面的总碳和总氮随着深度的变化特征趋于一致,总体是沿着深度往下逐渐减小(图4)。最大值分别出现在亚表层12 cm (SAF-1)和表层6 cm (BAF-1)处。计算的碳氮比(C/N)随着深度下降具有逐渐增加的趋势,但是分别在57 cm (SAF-1)和36 cm (BAF-1)处表现出骤减的波动变化。
已有研究认为江苏北部潮滩湿地沉积物中有机碳含量低于1%,总氮含量低于0.1% [19] 。我们测的是沉积物总碳和总氮含量,显然,总碳含量是高于前人的有机碳数据,总氮含量较为一致。在泉州湾海岸湿地,王爱军等[23] 对多根柱芯利用元素分析仪进行了沉积物中总碳,总有机碳和总氮含量测试,认为无机碳主要集中在粗颗粒组分中,含量较低(小于0.2%)。因此,我们的结果也可以指代沉积物中总有机碳含量变化。将其作为有机碳指标,与世界其它地区潮摊湿地沉积物的有机碳和总氮含量是可比较的。在美国马萨诸塞州潮滩湿地,有机碳含量变化范围是2%~5%,总氮是0.2%~0.4% [24] 。在香港维多利亚湾潮滩湿地,有机碳含量变化范围是2%~3%,总氮是0.09%~0.11% [25] 。

Figure 2. Variation of water content, dry bulk density and sediment porosity with depth
图2. 沉积物含水量、干容重和孔隙度随深度的变化特征
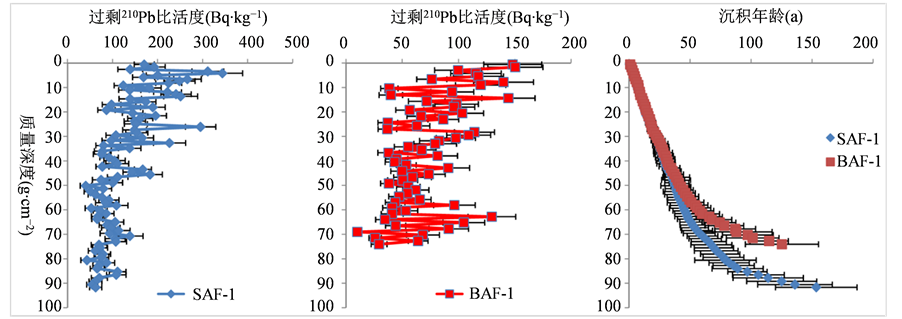
Figure 3. Variation of unsupported 210Pb radioactivity with mass depth and the depth-age model
图3. 过剩210Pb放射性比活度随质量深度的变化以及深度-年代框架
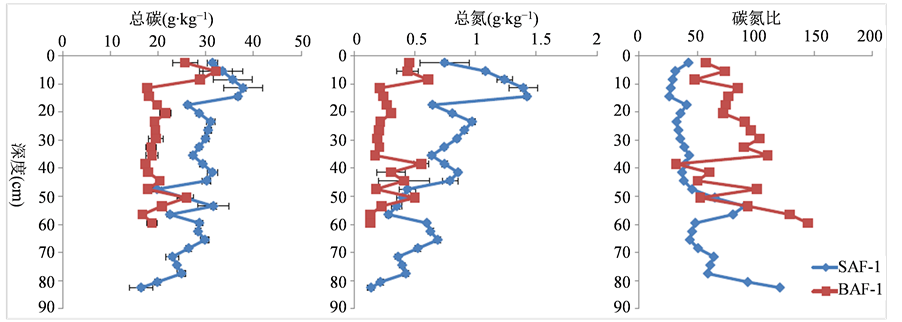
Figure 4. Variation of total carbon, total nitrogen, and C/N with depth
图4. 总碳、总氮和碳氮比随深度的变化特征
3.4. RERCA和RERNA
近150年来,碳累积速率(RERCA)和氮累积速率(RERNA)随着时间不断增加(图5),展现出极强的固碳潜力。两个沉积柱芯(SAF-1和BAF-1)的平均RERCA分别是165 gC∙m−2∙a−1和116 gC∙m−2∙a−1,这与报
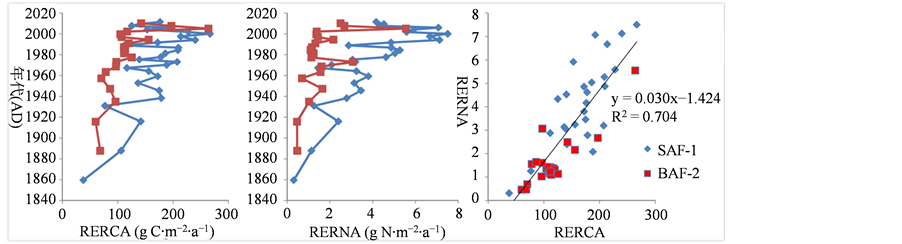
Figure 5. Temporal variation of recent rate of carbon accumulation (RERCA) and recent rate of nitrogen accumulation (RERNA) over the past 150 years and the relationship between RERCA and RERNA in the sediments
图5. 近现代碳累积速率(RERCA)和近现代氮累积速率(RERNA)随时间变化趋势以及二者之间的相关关系

Figure 6. Comparison of the calculated C storage per unit area (kg C∙m−2) in wetlands in a worldwide context. Data sources are (1) Yancheng coastal wetland in this study; (2) Sanjiang Plain wetland in NE China [11] ; (3) Alpine peatlands in NE China [12] ; (4) Lowland peatlands in Indonesia [29] ; (5) West Siberia peatlands [30] ; (6) MWP peatlands, NE Germany [31] ; (7) Afforested peatlands in Ireland [32] ; (8) Alpine peatland in Isle of Man [33] ; (9) Scottish peatlands [34] ; (10) Ombrotrohpicpeatlands in eastern Canada [35] ; (11) North Highland Lake District, USA [36] ; (12) Temperate wetland in Ohio, USA [37] ; (13) Tropical wetland in Costa Rica [37] ; (14) Alpine peatlands in Andes, Ecuador [38] ; (15) Thicket restoration sites in the Eastern Cape, South Africa [39] ; (16) Equatorial peat bog in East Africa [40] ; (17) SE Australian coastal wetlands [41]
图6. 全球湿地近现代碳累积通量比较(kg C∙m−2)。数据来源:(1) 中国盐城滨海湿地,本研究;(2) 中国东北三江平原湿地[11] ;(3) 中国东北山地泥炭地[12] ;(4) 印度尼西亚低地泥炭地[29] ;(5) 西西伯利亚泥炭地[30] ;(6) 德国东北MWP泥炭地[31] ;(7) 爱尔兰森林泥炭地[32] ;(8) 马恩岛山地泥炭地[33] ;(9) 苏格兰泥炭地[34] ;(10) 加拿大东部泥炭地[35] ;(11) 美国北部高地湖区湿地[36] ;(12) 美国俄亥俄州湿地[37] ;(13) 哥斯达黎加热带湿地[37] ;(14) 厄瓜多尔山地泥炭地[38] ;(15) 南非修复湿地[39] ;(16) 东非赤道湿地[40] ;(17) 澳大利亚东南滨海湿地[41]
道的全球盐沼湿地和红树林湿地碳堆积速率(220 gC∙m−2∙a−1) [16] [26] 是一致的。射阳港平均RERNA分别是3.99 gN∙m−2∙a−1和1.68 gN∙m−2∙a−1。通过线性回归分析可以发现,RERCA和RERNA之间具有显著的相关关系(R2 = 0.704, n = 48)。在南美Patagonia湿地,采用与我们同样的方法估算出该湿地RERCA变化范围为8.5~87.1 gC∙m−2∙a−1,RERNA变化范围为0.15~2.37 gN∙m−2∙a−1,RERCA与RERNA之间具有显著的相关关系[27] 。这与我们的研究结果是一致的。这主要是因为氮作为生态系统中一种主要的限制性营养元素,在沉积物有机质输入和分解过程中扮演着重要角色。有研究报道盐城互花米草滩涂有机碳年增加速率为104 gC∙m−2∙a−1 [28] ,我们的RERCA与其吻合较好;在同一研究中,他们报道了光滩总氮年增加速率为1 gN∙m−2∙a−1 [28] ,互花米草滩总氮年增加速率为8 gN∙m−2∙a−1 [28] ,我们的RERNA在光滩区域(1.68 gN∙m−2∙a−1)略大,在互花米草滩地(3.99 gN∙m−2∙a−1)则是略小,仍都保持在同一数量级上。
根据RERCA和RERNA,我们进一步估算出盐城湿地过去150年累积的碳、氮通量,即17.4~24.8 kgC∙m−2和0.25~0.59 kgN∙m−2。近年来在全球各地开展了很多不同类型湿地碳累积研究工作,涌现出的大量累积通量数据可供比较,以最终形成全球碳累积速率制图(图6)。从图上可以清晰看到,不同地区不同类型的湿地,其近现代碳累积通量存在显著差异。这主要是受到植被类型、气候因子(包括温度,降水)以及人类干扰的影响。因此,研究RERCA和RERNA的时间变化和空间差异,将有助于进一步探究湿地生态系统对气候变化和人类活动影响的反馈机制。
4. 结论
本研究中,通过对盐城滨海湿地互花米草滩涂和光滩沉积柱芯进行放射性210Pb定年,结合沉积物干容重、碳和氮含量分析,计算出近现代碳累积速率(RERCA)和近现代氮累积速率(RERNA)分别是116~165 gC∙m−2∙a−1和1.68~3.99 gN∙m−2∙a−1;进而估算出近150年来碳、氮储存通量分别为17.4~24.8 kgC∙m−2和0.25~0.59 kgN∙m−2,而且其历史变化表现出增强态势。这与同一区域的其它报道及不同区域的相关研究结果是具有较强的可比较性。基于RERCA和RERNA的估算,将促进对滨海湿地碳、氮累积历史和潜力变化的科学评估,也能增进滨海湿地对当前气候变化和人类活动双重影响的反馈机制的理解。
基金项目
江苏省自然科学基金(BK20131058)和国家自然科学基金青年基金(41301215)。
文章引用
鲍锟山,全桂香,刘复刚. 盐城滨海湿地近现代碳、氮累积历史
Recent History of Carbon and Nitrogen Accumulation Rates in Yancheng Coastal Wetland,
China[J]. 自然科学, 2015, 03(04): 137-146. http://dx.doi.org/10.12677/OJNS.2015.34018
参考文献 (References)
- 1. 段晓男, 王效科, 逯非, 等. 中国湿地生态系统固碳现状和潜力[J]. 生态学报, 2008, 28(2): 463-469.
- 2. Charman, D.J., Beilman, D.W., Blaauw, M., Blaauw, M., Booth, R.K., Brewer, S., et al. (2013) Climate-Related Changes in Peatland Carbon Accumulation during the Last Millennium. Biogeosciences, 10, 929-944. http://dx.doi.org/10.5194/bg-10-929-2013
- 3. 葛全胜, 戴君虎, 何凡能, 等. 过去300年中国土地利用、土地覆被变化与碳循环研究[J]. 中国科学D辑: 地球科学, 2008, 38(2): 197-210.
- 4. Gorham, E., Lehman, C., Dyke, A., Clymo, D. and Janssens, J. (2012) Long-Term Carbon Sequestration in North American Peatlands. Quaternary Science Reviews, 58, 77-82. http://dx.doi.org/10.1016/j.quascirev.2012.09.018
- 5. Ruppel, M., Valiranta, M., Virtanen, T. and Korhola, A. (2013) Postglacial Spatiotemporal Peatland Initiation and Lateral Expansion Dynamics in North America and Northern Europe. Holocene, 23, 1596-1606. http://dx.doi.org/10.1177/0959683613499053
- 6. Weckstrom, J., Seppa, H. and Korhola, A. (2010) Climatic Influence on Peatland Formation and Lateral Expansion in Sub-Arctic Fennoscandia. Boreas, 39, 761-769. http://dx.doi.org/10.1111/j.1502-3885.2010.00168.x
- 7. Gao, Y. and Couwenberg, J. (2014) Carbon Accumulation in a Permafrost Polygon Peatland: Steady Long Term Rates in Spite of Shifts between Dry and Wet Condition. Global Change Biology, 21, 803-815. http://dx.doi.org/10.1111/gcb.12742
- 8. Dommain, R., Couwenberg, J. and Joosten, H. (2011) Development and Carbon Sequestration of Tropical Peat Domes in South-East Asia: Links to Post-Glacial Sea-Level Changes and Holocene Climate Variability. Quaternary Science Reviews, 30, 999-1010. http://dx.doi.org/10.1016/j.quascirev.2011.01.018
- 9. Page, S., Rieley, J.O. and Banks, C.J. (2011) Global and Regional Importance of the Tropical Peatland Carbon Pool. Global Change Biology, 17, 798-818. http://dx.doi.org/10.1111/j.1365-2486.2010.02279.x
- 10. Bao, K., Yu, X., Jia, L. and Wang, G.P. (2010) Recent Carbon Accumulation in Changbai Mountain Peatlands, Northeast China. Mountain Research and Development, 30, 33-41. http://dx.doi.org/10.1659/MRD-JOURNAL-D-09-00054.1
- 11. Bao, K., Zhao, H., Xing, W., et al. (2011) Carbon Accumulation in Temperate Wetlands of Sanjiang Plain, Northeast China. Soil Science Society of America Journal, 75, 2386-2397. http://dx.doi.org/10.2136/sssaj2011.0157
- 12. Bao, K., Wang, G. and Xing, W. (2015) Accumulation of Organic Carbon over the Past 200 Years in Alpine Peatlands, Northeast China. Environmental Earth Science, 73, 7489-7503. http://dx.doi.org/10.1007/s12665-014-3922-1
- 13. Zhao, Y., Yu, Z., Tang, Y., et al. (2014) Peatland Initiation and Carbon Accumulation in China over the Last 50,000 Years. Earth Science Review, 128, 139-146. http://dx.doi.org/10.1016/j.earscirev.2013.11.003
- 14. Wang, M., Chen, H., Wu, N., et al. (2014) Carbon Dynamics of Peatlands in China during the Holocene. Quaternary Science Reviews, 99, 34-41. http://dx.doi.org/10.1016/j.quascirev.2014.06.004
- 15. 侯雪景, 印萍, 丁旋, 等. 青岛胶州湾大沽河口滨海湿地的碳埋藏能力[J]. 海洋地质前沿, 2012(28): 17-26.
- 16. Chmura, G.L., Anisfeld, S.C., Cahoon, D.R., et al. (2003) Global Carbon Sequestration in Tidal, Saline Wetland Soils. Global Biogeochemical Cycles, 17, Article ID: GB1111. http://dx.doi.org/10.1029/2002gb001917
- 17. Choi, Y. and Wang, Y. (2004) Dynamics of Carbon Sequestration in a Coastal Wetland Using Radiocarbon Measurements. Global Biogeochemical Cycles, 18, Article ID: GB4016. http://dx.doi.org/10.1029/2004GB002261
- 18. 孙贤斌, 刘红玉. 江苏海滨湿地研究进展[J]. 海洋环境科学, 2011(30): 599-602.
- 19. Gao, J., Bai, F., Yang, Y., et al. (2012) Influence of Spartina Colonization on the Supply and Accumulation of Organic Carbon in Tidal Salt Marshes of Northern Jiangsu Province, China. Journal of Coastal Research, 28, 486-498. http://dx.doi.org/10.2112/JCOASTRES-D-11-00062.1
- 20. 任美锷. 江苏海岸和海涂资源综合调查报告[M]. 北京: 海洋出版社, 1986: 517.
- 21. Liu, Z., Pan, S., Liu, X., et al. (2010) Distribution of Cs-137 and Pb-210 in Sediments of Tidal Flats in North Jiangsu Province. Journal of Geography Science, 20, 91-108. http://dx.doi.org/10.1007/s11442-010-0091-3
- 22. 王爱军, 高抒, 贾建军, 等. 江苏王港盐沼的现代沉积速率[J]. 地理学报, 2005, 60(1): 61-70.
- 23. 王爱军, 陈坚, 李东义, 等. 泉州湾海岸湿地沉积物C、N的空间变化[J]. 环境科学, 2007, 28(10): 2361-2367.
- 24. Wang, X.C., Chen, R.F. and Berry, A. (2003) Sources and Preservation of Organic Matter in Plum Island Salt Marsh Sediments (MA, USA): Long-Chain N-Alkanes and Stable Carbon Isotope Compositions. Estuarine, Coastal and Shelf Science, 58, 917-928. http://dx.doi.org/10.1016/j.ecss.2003.07.006
- 25. Lau, S.S. and Chu, L.M. (1999) Contaminant Release from Sediments in a Coastal Wetland. Water Research, 33, 909- 918. http://dx.doi.org/10.1016/S0043-1354(98)00286-3
- 26. 曹磊, 宋金明, 李学刚, 等. 滨海盐沼湿地有机碳的沉积与埋藏研究进展[J]. 应用生态学报, 2013, 24(7): 2040- 2048.
- 27. León, C.A. and Oliván, G. (2014) Recent Rates of Carbon and Nitrogen Accumulation in Peatlands of Isla Grande de Chiloé-Chile. Revista Chilena de Historia Natural, 87, 26. http://dx.doi.org/10.1186/s40693-014-0026-y
- 28. 高建华, 杨桂山, 欧维新. 苏北潮滩湿地不同生态带有机质来源辨析与定量估算[J]. 环境科学, 2005, 26(6): 51- 56.
- 29. Jaenicke, J., Rieley, J., Mott, C., et al. (2008) Determination of the Amount of Carbon Stored in Indonesian Peatlands. Geoderma, 147, 151-158. http://dx.doi.org/10.1016/j.geoderma.2008.08.008
- 30. Beilman, D.W., MacDonald, G.M., Smith, L.C., et al. (2009) Carbon Accumulation in Peatlands of West Siberia over the Last 2000 Years. Global Biogeochemical Cycles, 23, Article ID: GB1012. http://dx.doi.org/10.1029/2007gb003112
- 31. Zauft, M., Fell, H., Glaber, F., et al. (2010) Carbon Storage in the Peatlands of Mecklenburg-Western Pomerania, Northeast Germany. Mires and Peat, 6, 1-12.
- 32. Wellock, M.L., Reidy, B., Laperle, C.M., et al. (2011) Soil Organic Carbon Stocks of Afforested Peatlands in Ireland. Forestry, 84, 441-451. http://dx.doi.org/10.1093/forestry/cpr046
- 33. Weissert, L. and Disney, M. (2013) Carbon Storage in Peatlands: A Case Study on the Isle of Man. Geoderma, 204, 111-119. http://dx.doi.org/10.1016/j.geoderma.2013.04.016
- 34. Chapman, S.J., Bell, J., Donnelly, D., et al. (2009) Carbon Stocks in Scottish Peatlands. Soil Use and Management, 25, 105-112. http://dx.doi.org/10.1111/j.1475-2743.2009.00219.x
- 35. Turunen, J., Roulet, N., Moore, T., et al. (2004) Nitrogen Deposition and Increased Carbon Accumulation in Ombrotrophic Peatlands in Eastern Canada. Global Biogeochemical Cycles, 18, Article ID: GB3002. http://dx.doi.org/10.1029/2003GB002154
- 36. Buffam, I., Carpenter, S.R., Yeck, W., et al. (2010) Filling Holes in Regional Carbon Budgets: Predicting Peat Depth in a North Temperate Lake District. Journal of Geophysical Research—Biogeosciences, 115, 1-16. http://dx.doi.org/10.1029/2009JG001034
- 37. Bernal, B. and Mitsch, W.J. (2008) A Comparison of Soil Carbon Pools and Profiles in Wetlands in Costa Rica and Ohio. Ecological Engineering, 34, 311-323. http://dx.doi.org/10.1016/j.ecoleng.2008.09.005
- 38. Chimner, R.A. and Karberg, J.M. (2008) Long-Term Carbon Accumulation in Two Tropical Mountain Peatlands, Andes Mountain, Ecuador. Mires and Peat, 3, 1-10.
- 39. Mills, A.J. and Cowling, R.M. (2006) Rate of Carbon Sequestration at Two Thicket Restoration Sites in the Eastern Cape, South Africa. Restoration Ecology, 14, 38-49. http://dx.doi.org/10.1111/j.1526-100X.2006.00103.x
- 40. Aucour, A., Bonnefille, R. and Hillaire-Marcel, C. (1999) Source and Accumulation Rates of Organic Carbon in an Equatorial Peat Bog (Burundi, East Africa) during the Holocene: Carbon Isotope Constraints. Palaeogeography, Palaeoclimatology, Palaeoecology, 150, 179-189. http://dx.doi.org/10.1016/S0031-0182(98)00222-3
- 41. Saintilan, N., Rogers, K., Mazumder, D., et al. (2013) Allochthonous and Autochthonous Contributions to Carbon Accumulation and Carbon Store in Southeastern Australian Coastal Wetlands. Estuarine, Coastal and Shelf Science, 128, 84-92. http://dx.doi.org/10.1016/j.ecss.2013.05.010