Journal of Water Resources Research
Vol.
11
No.
02
(
2022
), Article ID:
50560
,
12
pages
10.12677/JWRR.2022.112018
博斯腾湖水质年内时空特征及其驱动因素分析
程勇1,周洪华2*,陈世峰2,叶朝霞2,朱成刚2
1新疆塔里木河流域巴音郭楞管理局,新疆 库尔勒
2中国科学院新疆生态与地理研究所,荒漠与绿洲生态国家重点实验室,新疆 乌鲁木齐
收稿日期:2022年2月21日;录用日期:2022年4月1日;发布日期:2022年4月22日

摘要
湖泊在干旱区水资源中发挥着重要的作用,而水质恶化是湖泊水资源开发利用的重大威胁之一。本研究以我国最大的内陆淡水湖——博斯腾湖为例,分析了湖泊年内水质时空变化特征,并探讨了其驱动因素。研究结果表明:博斯腾湖的主要污染物是TDS,COD和TP,且TDS年内空间分布上呈现出西南低、东北高的趋势,COD在空间上四月和六月表现为西南低、东北高,在八月和十月表现为西南高、东北低,TP在空间上四月表现为西南低、东北高,在十月表现为西南高、东北低;NH3-N含量较低,且空间分布均匀,不是威胁博斯腾湖水质的主要因素。博斯腾湖水质存在显著年内分布差异,六月和八月水体TDS和COD含量较高而TP含量较低,四月和十月TDS和COD含量较低而TP含量较高。相较于外源污染物,长期滞留湖区的内源污染物对博斯腾湖年内水质变化的影响更显著,而温度是加剧博斯腾湖水质年内差异的主要催化剂。因此,通过调节年内不同温度时段下的湖泊水位,可以有效调控博斯腾湖年内水质状况。
关键词
盐分,富营养化,内源污染物,外源污染物,水位

Spatial-Temporal Variation of Water Quality and Its Driver-Factors Analysis in Bosten Lake, China
Yong Cheng1, Honghua Zhou2*, Shifeng Chen2, Zhaoxia Ye2, Chenggang Zhu2
1Bayinguoleng Water Resources Management Department of Xinjiang Tarim River Basin Authority, Korla Xinjiang
2State Key Laboratory of Desert and Oasis Ecology, Xinjiang Institute of Ecology and Geography, Chinese Academy of Sciences, Urumqi Xinjiang
Received: Feb. 21st, 2022; accepted: Apr. 1st, 2022; published: Apr. 22nd, 2022

ABSTRACT
Lakes in the arid and semi-arid regions play a critical role in valuable water resources, while deterioration in water quality would threaten the societies, economies, biological diversity and fragile environment conservation in these areas. In this study, 68 monitoring points around the Bosten Lake, the largest inland freshwater lake in China, were established to investigate the spatial-temporal variation of water quality during the year. The results showed that the main pollutants of the lake were total dissolved solids (TDS), chemical oxygen demand (COD), and total phosphorus (TP), moreover, TDS content in the southwestern part of lake was generally lower than that in the eastern and northern part of lake; COD content in the southwestern part of lake was generally lower than that in the eastern and northern part of lake in April and June, but it in southwestern part of lake was generally higher than that in the eastern and northern part of lake in August and October; TP content in the southwestern part of lake was generally lower than that in the eastern and northern part of lake in April, but it in southwestern part of lake was generally higher than that in the eastern and northern part of lake in October. NH3-N content, which was evenly distributed in the lake area, was not the main contaminant in the Lake. Water quality in the Lake also showed a temporal distribution difference. The TDS content of the lake in June and August was higher than that in April and October, while the COD and TP contents were opposite to the TDS content. Allochthonous pollutants composed by the wastewater from agricultural irrigations and inflow from the rivers affected the spatial-temporal water quality, but this effect was not significant. Endogenous pollutants constituted the key reason for the spatial difference, and the solubility change of endogenous and exogenous pollutants caused by temperature mainly determined the annual change of water quality. The water quality of Bosten Lake could be improved by adjusting the water level of the lake in different temperature periods annually.
Keywords:Salinity, Eutrophication, Endogenous Pollutants, Exogenous Pollutants, Water Level

Copyright © 2022 by author(s) and Wuhan University.
This work is licensed under the Creative Commons Attribution International License (CC BY 4.0).
http://creativecommons.org/licenses/by/4.0/


1. 引言
湖泊是地表水资源与水循环的重要载体,湖泊水资源,尤其是淡水湖泊资源是干旱半干旱区最为稀缺和宝贵的资源之一,对于干旱半干旱区的社会、经济发展和脆弱生态环境保护均有着至关重要的作用 [1] [2]。然而,干旱半干旱区的淡水湖泊资源面临严峻的富营养化或盐分污染,且水质污染有愈演愈烈的趋势 [3] - [8]。淡水湖泊质量的恶化正严重威胁着当地农业生产、生物多样性以及居民生活 [9]。因此,详细阐释淡水湖泊水质时空变化特征及其驱动因素,对于水资源的合理开发利用及科学管理具有积极的指导意义。
博斯腾湖是中国最大的内陆淡水湖,也是世界干旱区的典型内陆淡水湖泊之一。博斯腾湖承担着流域128万人的社会、经济、生活及生态系统发展所需的水资源重担。自1980s,由于气候变化和人类活动的双重影响,博斯腾湖逐渐由淡水湖转变为富营养化的微咸水湖 [2] [10] [11] [12] [13] [14]。水质的恶化降低了湖泊生物多样性,甚至导致了部分鱼类的灭绝;水质恶化还影响着区域农业生产和天然植被的发育与演替 [10] [11] [12] [13] [14]。因此,如何有效改善水质已成为博斯腾湖水资源管理的一项紧迫而富有挑战性的任务。
众多研究表明,从年际间来看,博斯腾湖水质恶化主要是由外源污染物入湖造成的 [4] [12] [15] [16],但也有研究认为1980s以来湖泊沉积物中的内源污染物对水质的变化有着重要影响 [17]。然而,博斯腾湖年内水质变化特征及其驱动因素的研究较少。本文解析了博斯腾湖水质的年内时空变化特征,并探讨了其主要影响因素,为改善博斯腾湖水质、促进湖泊水资源可持续管理提供科学依据。
2. 研究区概况
博斯腾湖(86˚19'E~87˚28'E,41˚46'N~42˚08'N,简称博湖)位于新疆天山南麓,是开都河的尾闾、孔雀河的源头(图1)。博湖是博斯腾湖流域(简称博湖流域)的水资源调配中心,为流域灌溉、生活、生产和生态提供水资源,调节着流域洪涝与干旱 [2],同时也是塔里木河的重要水源地和新疆的重要渔业、芦苇基地。由于其在区域经济、社会、生态和气候中的重要作用,博湖先后被纳入“21世纪湖泊治理规划议程”、“新疆1311环保行动计划”和国家首批“生态环境保护试点湖泊”。博湖流域面积为13.34 × 10⁴ km2,多年平均气温为8.4℃,多年平均降水为68.2 mm,多年平均蒸发潜力2000 mm。博湖入湖河流有开都河、黄水沟、清水河等,但常年性入湖河流只有开都河,孔雀河是博湖的唯一出湖口。随着人类活动的大规模开展和全球气候变化的作用,博湖湿地退化、湖水矿化度升高、富营养化趋势加剧,生态环境问题加剧,严重影响着流域生态系统的稳定和生态服务功能 [18]。
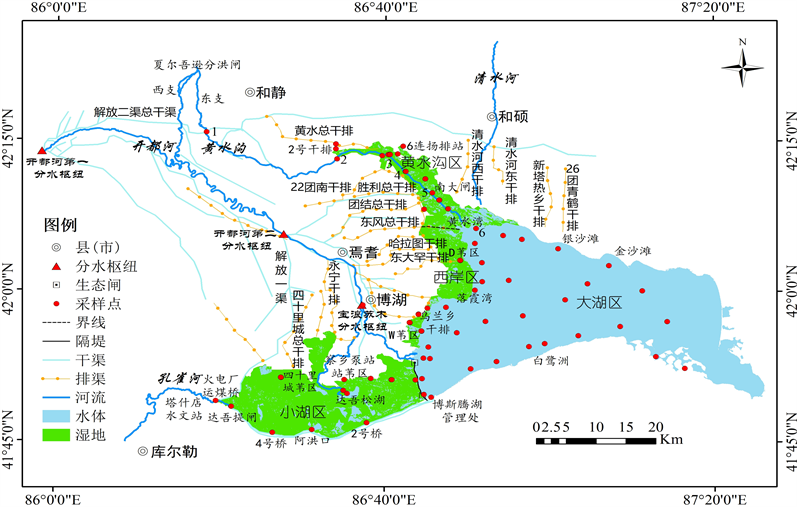
Figure 1. Study area and monitoring point sites
图1. 研究区及水质监测点布设
3. 材料与方法
3.1. 采样点布设
博湖水域辽阔,东西长55 km,南北平均宽20 km,水域面积多年平均为1002.4 km2,因此,如何实现全湖面的水质监测一直是水质研究的难点。自2001年起,巴州环境保护局在博湖建立了17个水质监测点 [1] [19],但这些监测点对于巨大的湖区而言,数量太少,无法覆盖整个湖面及周边区域,容易导致空间插值结果误差较大。为准确掌握博湖水质空间分布,我们在原17个监测点的基础上,增设了51个监测点,其中湖面共设32个监测点,出入湖区和周边湿地共设36个监测点(图1),合计68个水质监测点,基本均匀地覆盖了整个湖面及其周边,可以较好地呈现全湖区的水质状况。于2019年4、6、8、10月我们在每个监测点共进行了四次水质取样和分析(2月和12月博湖湖面处于结冰期,未取样)。
3.2. 水质指标确定及测定
众多研究表明盐分和富营养化是导致博湖水污染的主要原因 [12] [15] [20] [21] [22]。因此,本研究的水质指标确定为矿化度(TDS)、化学需氧量(COD)、氨氮(NH3-N)和总磷(TP);同时,在测量水质时,我们还测定了30~50 cm的表层湖水温度(LSWT)。TDS、NH3-N、TP和LSWT用智能便携式多参数水质分析仪同步测量(YSI ProPlus, YSI Environmental, Inc., Ohio, USA),COD采用重铬酸钾回流法测量。水质分类标准采用《地表水环境质量标准》(GB3838-2002) (表1),淡水与咸水分类标准采用普适分类标准(表2)。
Table 1. Classification standard of surface water quality
表1. 地表水水质分类标准
Table 2. Classification standard of water salinity
表2. 淡/咸水分类标准
3.3. 污染负荷计算
博湖外源污染物主要有两种输入方式:周边排水渠废水排入和开都河、黄水沟等河水入湖带入。同时湖水的出湖也会带走部分污染物,因此滞留在湖中的外源污染负荷计算如下:
(1)
(2)
(3)
(4)
式中: 分别为滞留在湖中的TDS、COD、NH3-N和TP总量;V为废水排入量;CIT,CIC,CIN,CIP分别为入湖水TDS、COD、NH3-N和TP含量;R为入湖水量; 为出湖水量;CTDS-outflow、CCOD-outflow、 和CTP-outflow分别为出湖水TDS、COD、NH3-N和TP含量。
3.4. 数据收集及分析
博湖出入湖水量数据、废水排入数据及水位数据来自于塔里木河流域巴音郭楞管理局。开都河和博湖水体中四大阳离子(Ca2+, Mg2+, Na+, K+)的浓度含量数据来自于2019年本课题组的试验测定。空间插值采用反距离加权法(IDW),作图采用Arcgis 8.0和Sigmaplot 12.0,统计分析采用SPSS13.0。
4. 结果与分析
4.1. 博斯腾湖水质时空变化特征
TDS是衡量博湖水质的重要指标,其在年内存在显著差异(图2)。博湖四月平均TDS含量为1.25 g/L,且东北高、西南低;六月TDS含量显著抬升(P < 0.01),平均值为1.39 g/L,且西南低、南部和北部高;八月TDS含量持续升高(P < 0.01),平均值达1.59 g/L,且全湖区大部分区域水体的TDS含量均在1.5~1.6 g/L;但十月时,全湖水体TDS含量显著下降(P < 0.01),平均值为0.98 g/L,大部分水体均为淡水。
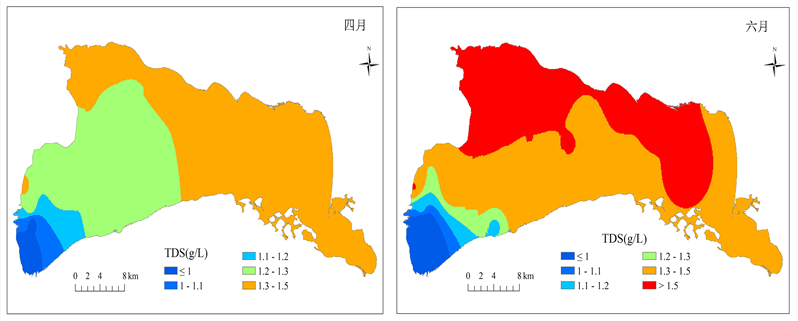

Figure 2. Spatial changes of TDS content in Bosten Lake during the year
图2. 博斯腾湖水体年内TDS含量变化
COD含量在年内也存在时空变化(图3)。博湖四月COD含量在3.46~73.04 mg/L范围内,平均含量为46.42 mg/L (劣ⅴ类),空间上表现为西南低、东北高;六月COD含量显著下降(P < 0.01),平均含量为16.14 mg/L,空间上呈现东南低、西北高;八月COD含量较六月抬升,低值集中在西南部,高值集中在东部和北部;十月COD含量显著高于六月和八月(P < 0.01),平均值达28.8 mg/L,呈现出西南高、东北低的趋势。

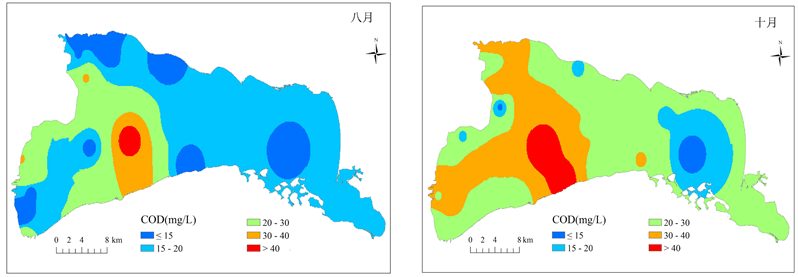
Figure 3. Spatial changes of COD content in Bosten Lake during the year
图3. 博斯腾湖水体年内COD含量变化
博湖水体四月和六月NH3-N含量平均值分别为0.34 mg/L和0.35 mg/L;八月NH3-N含量变幅为0.02 mg/L~0.45 mg/L,平均值较四月和六月下降,为0.25 mg/L,但差异并不显著;十月NH3-N含量持续下降,平均值为0.2 mg/L,显著低于四月和六月(P < 0.01)。博湖年内NH3-N含量整体上均处于II类水范围,且在空间上分布较为均匀,空间差异不大(图4),这表明NH3-N含量不是威胁博湖水质的主要因素。
TP含量时空变化与TDS相反(图5)。四月TP含量平均值为0.11 mg/L (IV类),空间上表现为西南低、东部高;六月和八月TP含量显著低于四月(P < 0.01),平均值为0.04 mg/L (III类),空间上分布相对均匀;但是到十月时,TP含量较六月和八月大幅抬升(P < 0.01),平均值达0.10 mg/L (IV类),空间分布上东部与北部低、西南部高。

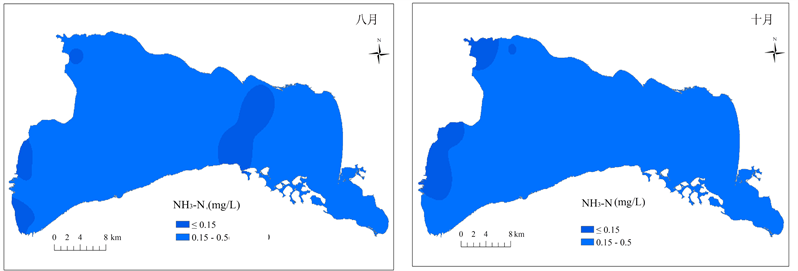
Figure 4. Spatial changes of NH3-N content in Bosten Lake during the year
图4. 博斯腾湖水体年内NH3-N含量变化


Figure 5. Spatial changes of TP content in Bosten Lake during the year
图5. 博斯腾湖水体年内TP含量变化
4.2. 博斯腾湖水质与外源污染负荷关系
根据污染负荷计算公式,博湖湖区滞留的污染物总量如图6所示。博湖年内TDS负荷变化与TDS含量变化呈同步变化趋势,均为八月 > 六月 > 十月 > 四月,两者之间呈正相关,但相关性不显著(P > 0.05)。同样地,六月、八月和十月博湖COD、NH3-N和TP负荷与其相应的含量变化趋势一致,但相关性也并不显著(P > 0.05)。这表明尽管外源污染影响博湖水质,但它并不是导致水质恶化的关键因素。

Figure 6. Pollutants amount of allochthonous sources retained in Bosten Lake during the year
图6. 博斯腾湖年内滞留湖区的外源污染负荷
4.3. 博斯腾湖水质与水位关系
由于博湖降水、渗漏和承压水补给等因素在长期过程中相对稳定 [23],入湖水量、出湖水量和蒸发损失是影响博湖水量平衡的三大主要因素。滞留湖泊的水量(入湖水量 − 出湖水量)直接决定博湖水位,两者呈极显著正相关(r = 0.983, P < 0.01),滞留水量带入湖泊的外源污染负荷也与湖泊水位呈正相关(图7)。据此推断,湖泊水位越高,滞留在湖区的外源污染负荷越高,这将逐渐抬升湖区水质指标的含量,导致水质恶化。然而,相关分析表明,博湖水位与水体TDS和NH3-N含量呈现出极显著的负相关(P < 0.01,图7),即随着湖泊水位的升高,水体TDS和NH3-N含量越低。这进一步证实,外源污染物可能不是影响博湖年内水质差异的主要原因。

Figure 7. Relationships between water level and accumulated water quantity, accumulated pollutants amount retained in the lake, and mean content of water quality of the lake water
图7. 博斯腾湖水位与年内累积水量、外源污染负荷和水质关系
4.4. 博斯腾湖水质与水温关系
博湖表层水温(LSWT)平均值在年内的变化顺序为:十月 < 四月 < 六月 < 八月。散点图和曲线拟合表明(图8),LSWT与TDS含量呈极显著正相关(P < 0.01)、与TP含量呈极显著负相关(P < 0.01),与COD和NH3-N含量相关性未达到显著水平(P > 0.05)。
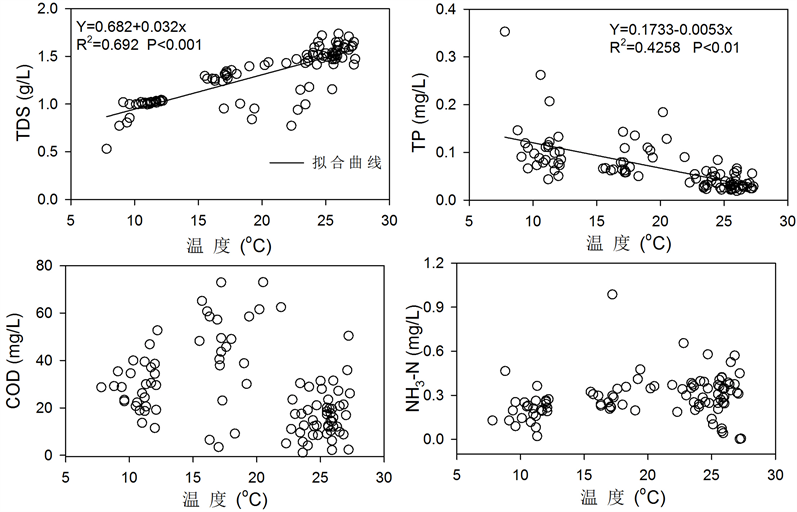
Figure 8. Scatter plots and curve simulations of the relationships between lake surface water temperature and mean contents of water quality indices of Bosten Lake
图8. 博斯腾湖表层水温与水质关系散点图及曲线模拟
5. 讨论
博斯腾湖是一个封闭的内陆湖,自1970s以来,盐化和富营养化就一直是困扰水质的两大问题 [10] [11] [12] [13] [14] [19]。由于博湖水域面积大,湖面监测点少,水质空间分布一直是博湖水质研究的难题,我们在原17个监测点的基础上,加密布设了68个水质监测点,均匀覆盖了整个湖区及其周边,以便准确地监测和分析博湖的水质时空分异特征。我们的监测分析显示,TDS、COD和TP是影响博湖年内水质变化的主要因素;空间分布上,西南部水质较好,东部和北部水质较差。一般而言,湖泊污染物包括外源污染和内源污染两大类。博湖的外源污染主要由入湖水携带进入 [12] [21],而内源污染主要为长期滞留湖中的污染物和沉积在底泥中的污染源 [19] [22]。众多研究者从年际角度提出,博湖水质恶化的主要原因是入湖的外源污染物累积 [4] [10] [12] [15] [16] [19] [21] [24],但Yu等认为,1950s之前博湖泥沙累积率较低,水质主要受外源污染影响,而1980s后,泥沙积累率迅速增加,大量污染物伴随泥沙沉积在了湖底,形成了数量巨大的内源污染源 [17]。我们的研究也发现,目前博湖年内外源污染物对当年湖区水体的TDS、COD、TP和NH3-N含量的影响并不显著。此外,博湖沉积物累积空间分布呈现出东部高于西部 [17],这与博湖水质的空间分布基本一致。因此,内源污染物的释放可能是导致博湖水质年内差异的主要原因。
有研究表明,水温与水质关系密切 [25] [26] [27] [28]。我们的研究显示,水温与TDS呈显著正相关,与TP含量呈显著负相关。这可能是因为水温影响水中污染物的释放速度。TDS浓度指征水中溶解性固体总量,水体中的绝大多数可溶性固体物质溶解度都与温度呈正相关。根据平衡运动原理,当温度升高时,可溶性固体物质溶解加速,TDS含量将升高,当温度降低时,可溶性固体物种溶解度下降,TDS含量减小,这可能是导致六月和八月博湖水体TDS含量较四月和十月大幅抬升的主要原因。水样离子分析表明,博湖入湖水体(开都河河水)四大阳离子(Ca2+, Mg2+, Na+, K+)中,Ca2+浓度最高,占四种阳离子总浓度的54.93%,博湖湖区水体中四大阳离子中Ca2+浓度也最高,占比48.33%。博湖高浓度的Ca2+与 易形成不易溶解的磷酸钙,而磷酸钙具有特殊的反温度效应,即其溶解度与温度呈负相关,温度越低,磷酸钙的溶解度越高,反之亦然。这可能解释了为什么博湖十月和四月TP含量高,而六月和八月TP含量低。
此外,博湖水位与水体TDS、COD、NH3-N含量呈显著负相关。根据水量平衡,入湖量、出湖量和蒸发损失量之间的差异直接决定了水位变化。因此,要抬升水位就必须增加入湖水量,大量淡水入湖可以稀释湖中内源污染的浓度,降低水体中TDS、COD和NH3-N含量,改善水质。但是水位与水体中TP含量呈正相关,这可能是因为入湖水中Ca2+过高,形成大量磷酸钙悬浮在水中或沉积在底泥中,增加了磷的内源污染量。
由此可见,每年5~9月高温时大部分污染物的溶解度较大,水体中盐分等含量较高,此时应大量增加入湖水量和出湖水量。大量的入湖水量可以搅动底泥,使得滞留在湖中的内源污染物加速运动,将污染物最大程度的与水混合,此时大量的出湖水量可以将这些高盐分或高污染含量的水体带出湖区,减少滞留在湖中的内源污染源,同时也满足农业生产和生态保护的需水高峰需求;另外高温下保持低水位运行还可以降低湖面蒸发损耗。在10月~翌年4月温度较低时,减少出湖水量,入湖水量主要用于抬升湖区水位,此时入湖的淡水可以稀释仍然滞留在湖中的内源污染物浓度,从而有效改善湖泊水质。
6. 结论
1) TDS、COD和TP是导致博湖水质恶化的主要污染物。博湖年内水质时空差异较大,六月和八月水体TDS和COD含量较高而TP含量较低,四月和十月TDS和COD含量较低而TP含量较高。
2) 除随入湖水带入的外源污染物外,长期滞留湖区的内源污染物对博湖年内水质变化的影响更明显,而温度是加剧博湖水质年内差异的主要催化剂。
3) 为了改善博湖年内水质,在未来的水资源管理中,应在夏季和秋季高温时保持低水位运行,在春季和冬季低温时保持高水位运行。
基金项目
本研究由新疆自然科学基金重点项目(2021D01D01)和新疆兵团第九师科技局科技计划项目(2020JS016)资助。
文章引用
程 勇,周洪华,陈世峰,叶朝霞,朱成刚. 博斯腾湖水质年内时空特征及其驱动因素分析
Spatial-Temporal Variation of Water Quality and Its Driver-Factors Analysis in Bosten Lake, China[J]. 水资源研究, 2022, 11(02): 169-180. https://doi.org/10.12677/JWRR.2022.112018
参考文献
- 1. ZHANG, L., SHEN, T., CHENG, Y., et al. Temporal and spatial variations in the bacterial community composition in Lake Bosten, a large, brackish lake in China. Scientific Reports, 2020, 10: Article No. 304. https://doi.org/10.1038/s41598-019-57238-5
- 2. ZHOU, H., CHEN, Y., PERRY, L., et al. Implications of climate change for water management of an arid inland lake in Northwest China. Lakeand Reservoir Management, 2015, 31: 202-213. https://doi.org/10.1080/10402381.2015.1062834
- 3. CARDONA, A., CARRILLO, R. and HUIZAR, A. Salinization in coastal aquifers of arid zones: An example from Santo Domingo, Baja California Sur, Mexico. Environmental Geology, 2004, 45(3): 350-366. https://doi.org/10.1007/s00254-003-0874-2
- 4. YAO, J., CHEN, Y., ZHAO, Y., et al. Hydroclimatic changes of Lake Bosten in northwest China during the last decades. Scientific Reports, 2018, 8: Article No. 9118. https://doi.org/10.1038/s41598-018-27466-2
- 5. HUO, S., MA, C. and XI, B. Establishing water quality reference conditions for nutrients, chlorophyll a and Secchi depth for 7 typical lakes in arid and semiarid ecoregion, China. Environmental Earth Sciences, 2015, 73(8): 4739-4748. https://doi.org/10.1007/s12665-014-3760-1
- 6. MA, L., WU, J., LIU, W., et al. Distinguishing between anthropogenic and climatic impacts on lake size: A modeling approach using data from Ebinur Lake in arid northwest China. Journal of Limnology, 2014, 73: 148-155. https://doi.org/10.4081/jlimnol.2014.852
- 7. 王丽艳, 李畅游, 孙标. 基于MODIS数据遥感反演呼伦湖水体总磷浓度及富营养化状态评价. 环境工程学报, 2014, 12(8): 5527-5534. WANG Liyan, LI Changyou and SUN Biao. Determination total phosphorus concentration and evaluation eutrophication of Hulun Lake with MODIS data. Chinese Journal of Environmental Engineering, 2014, 12(8): 5527-5534. (in Chinese)
- 8. LIU, H., YIN, Y. and PIAN, S. Disappearing lakes in semiarid northern China: Drivers and environmental impact. Environmental Science & Technology, 2013, 47(21): 12107-12114. https://doi.org/10.1021/es305298q
- 9. MA, L., ABUSUWAILI, J. and LIU, W. Environmentally sensitive grain size component records and its response to climatic and anthropogenic influences in Bosten Lake region, China. Scientific Reports, 2020, 10: Article No. 942. https://doi.org/10.1038/s41598-020-57921-y
- 10. RUSULI, Y., LI, L., AHMAD, S., et al. Dynamics model to simulate water and salt balance of Bosten Lake in Xinjiang, China. Environmental Earth Sciences, 2015, 74: 2499-2510. https://doi.org/10.1007/s12665-015-4257-2
- 11. TANG, X., XIE, G. and SHAO, K. Influence of salinity on the bacterial community composition in Lake Bosten, a large oligohaline lake in arid northwestern China. Applied & Environmental Microbiology, 2012, 78(13): 4748-4751. https://doi.org/10.1128/AEM.07806-11
- 12. 赛巴雅尔图, 陈敏鹏, 冯丽. 博斯腾湖流域农业面源污染现状分析[J]. 水资源保护, 2012, 28(2): 25-29. SAI Bayaertu, CHEN Minpeng and FENG Li. Agricultural non-point source pollution of Bosten Lake basin. Water Resources Protection, 2012, 28(2): 25-29. (in Chinese)
- 13. 赛巴雅尔图, 黄瑾, 谢贵娟, 等. 新疆博斯腾湖浮游细菌丰度对富营养化及咸化响应[J]. 湖泊科学, 2011, 23(6): 934-941. SAI Bayaertu, HUANG Jin, XIE Guijuan, et al. Response of planktonic bacterial abundance to eutrophication and salinization in Lake Bosten, Xinjiang. Journal of Lake Sciences, 2011, 23(6): 934-941. (in Chinese)
- 14. MISCHKE, S., WUNEMANN, B. The Holocene salinity history of Bosten Lake (Xinjiang, China) inferred from ostracod species assemblages and shell chemistry: Possible paleoclimatic implications. Quaternary International, 2006, 154: 100-112. https://doi.org/10.1016/j.quaint.2006.02.014
- 15. 吴敬禄, 马龙, 曾海鳌. 新疆博斯腾湖水质水量及其盐化特征分析[J]. 地理科学, 2013, 33(2): 231-237. WU Jinglu, MA Long and ZENG Haiao. Water quality and quantity characteristics and its evolution in Lake Bosten, Xinjiang over the past 50 years. Scientia Geographica Sinica, 2013, 33(2): 231-237. (in Chinese)
- 16. ZUO, Q., DOU, M., CHEN, X. I., et al. Physically-based model for studying the salinization of Bosten Lake in China. Hydrological Sciences Journal, 2006, 51(3): 432-449.
- 17. 于志同, 李广宇, 张恩楼, 等. 1860年以来博斯腾湖碳沉积过程演变[J]. 湖泊科学, 2019, 31(1): 293-304. YU Zhitong, LI Gonglong, ZHANG Enlou, et al. Process variations of sedimentary carbon accumulation in Lake Bosten since 1860. Journal of Lake Sciences, 2019, 31(1): 293-304. (in Chinese)
- 18. 周洪华, 李卫红, 陈亚宁, 等. 博斯腾湖水盐动态变化(1951-2011年)及对气候变化的响应[J]. 湖泊科学, 2014, 26(1): 55-65. ZHOU Honghua, LI Weihong, CHEN Yaning, et al. Water-salt succession patterns (1951-2011) and its response to climate change in Lake Bosten. Journal of Lake Sciences, 2014, 26(1): 55-65. (in Chinese)
- 19. 谢归娟, 张建平, 杨祥明, 等. 博斯腾湖水质现状(2010-2011年)及近50年来演变趋势[J]. 湖泊科学, 2013, 23(6): 837-846. XIE Guijuan, ZHANG Jianping, TANG Xiangming, et al. Spatio-temporal heterogeneity of water quality (2010-2011) and succession patterns in Lake Bosten during the past 50 years. Journal of Lake Sciences, 2013, 23(6): 837-846. (in Chi-nese)
- 20. LIU, Y., MU, S., BAO, A., et al. Effects of salinity and (an)ions on arsenic behavior in sediment of Bosten Lake, Northwest China. Environmental Earth Sciences, 2015, 73(8): 4707-4716. https://doi.org/10.1007/s12665-014-3755-y
- 21. LI, W. H., FU, A. H., ZHOU, H. H., et al. Analysis of trends and changes in the water environment of an inland river basin in an Arid Area. Water Environment Research, 2014, 86(2): 104-110. https://doi.org/10.2175/106143013X13807328849017
- 22. WUNNEMANN, B., MISCHKE, S. and CHEN, F. A Holocene sedimentary record from Bosten Lake, China. Palaeogeography, Palaeoclimatology, Palaeoecology, 2006, 234(2): 223-238. https://doi.org/10.1016/j.palaeo.2005.10.016
- 23. 孙占东, 王润. 气候背景下冰川在博斯腾湖水量平衡中的作用[J]. 湖泊科学, 2006, 18(5): 484-489. SUN Zhandong, WANG Run. Effect of glaciers change to water balance of Bosten Lake under climatic backgrounds. Journal of Lake Sciences, 2006, 18(5): 484-489. (in Chinese)
- 24. GUO, M., WU, W., ZHOU, X., et al. Investigation of the dramatic changes in lake level of the Bosten Lake in northwestern China. Theoretical and Applied Climatology, 2015, 119: 341-351. https://doi.org/10.1007/s00704-014-1126-y
- 25. ISLAM, M. A., BEARDALL, J. and COOK, P. Intra-strain variability in the effects of temperature on UV-B sensitivity of cyanobacteria. Photochemistry and Photobiology, 2018, 95(1): 306-314. https://doi.org/10.1111/php.13014
- 26. THOMAS, M. K., LITCHMAN, E. Effects of temperature and nitrogen availability on the growth of invasive and native cyanobacteria. Hydrobiologia, 2016, 763(1): 357-369. https://doi.org/10.1007/s10750-015-2390-2
- 27. XIAO, F, LING, F., DU, Y., et al. Evaluation of spatial-temporal dy-namics in surface water temperature of Qinghai Lake from 2001 to 2010 by using MODIS data. Journal of Arid Land, 2013, 5(4): 452-464. https://doi.org/10.1007/s40333-013-0188-5
- 28. CAO, H., TAO, Y., KONG, F., et al. Relationship be-tween temperature and cyanobacterial recruitment from sediments in laboratory and field studies. Journal of Freshwater Ecology, 2008, 23(3): 405-412. https://doi.org/10.1080/02705060.2008.9664217
