Pharmacy Information
Vol.
08
No.
03
(
2019
), Article ID:
30139
,
11
pages
10.12677/PI.2019.83011
Comparison of the Similarities and Differences of Quercetin on Gene Regulation in Mice Liver under Normal Diet and High-Fat Diet
Susu Wu, Jing Shang*
China Pharmaceutical University, Nanjing Jiangsu

Received: Apr. 24th, 2019; accepted: May 3rd, 2019; published: May 10th, 2019

ABSTRACT
Objective: Compare the similarities and differences of quercetin on gene regulation in mice liver under normal diet and high-fat diet. Method: Searching for the GSE62805 and GSE38141 which analyze the gene expression in liver of mice under normal diet or high-fat diet after treated with quercetin in NIH-Geo database. And analyze the data by GEO2R selecting the genes whose fold change are more than 2 or less than 0.5 as the regulated gene. Using David to conduct GO analysis for regulated genes, the regulated genes which are upregulated or downregulated simultaneously in both datasets as a group, the regulated genes which are upregulated in one dataset and downregulated in another datasets as the other group. Results: There are similarities and differences of quercetin on gene regulation in liver of mice under normal diet and high-fat diet. 1) There are 40 regulated genes which are upregulated or downregulated simultaneously in both datasets, including 28 upregulated genes and 12 downregulated genes. 2) There are 48 regulated genes which present opposite expression trend, including 11 regulated genes which are upregulated under normal diet but downregulated under high fat diet and 37 regulated genes which are downregulated under normal diet but upregulated under high fat diet. 3) The regulatory degree of quercetin on 40 regulated genes which present same trend in both datasets is different. 4) The 40 regulated genes which present same expression trend in both datasets are involved in synapse, secretion by cell and generation of cell-cell signaling and the 48 regulated genes which present opposite expression trend related to plasma membrane part, synapse and cell junction. Conclusion: The regulation of quercetin on gene expression in liver of mice is related to body state. The regulation is different in different body states.
Keywords:Quercetin, Normal Diet, High Fat Diet, Liver, Gene Expression
对比槲皮素在正常饮食和高脂饮食条件下 对小鼠肝脏基因调节的异同
吴诉诉,尚靖*
中国药科大学,江苏 南京

收稿日期:2019年4月24日;录用日期:2019年5月3日;发布日期:2019年5月10日

摘 要
目的:对比0.05%剂量时槲皮素在正常和高脂两种饮食条件下对小鼠肝脏基因调节的异同。方法:在NIH-Geo数据库中找到槲皮素干预小鼠肝组织基因表达的两个微阵列数据库GSE62805和GSE38141,运用GEO2R的分析方法分析槲皮素对小鼠肝脏基因表达谱的影响,选择有显著性差异(p < 0.05)并且差异倍数大于2或者小于0.5的基因进行分析对比。并用David数据库对两个数据库中槲皮素干预后差异基因表达趋势相同(均表现为上调或均表现为下调)以及表达趋势相反的基因进行GO富集分析。结果:饲料中添加0.05%的槲皮素饲喂小鼠20周,在正常饮食和高脂饮食两种条件下对小鼠肝脏基因的影响存在异同。1) 槲皮素在两种饮食条件下对小鼠肝脏基因表达谱的影响有40个基因调节趋势一致,其中有28个基因在两种饮食条件下都表现为上调,12个基因都表现为下调。2) 槲皮素在两种饮食条件下对小鼠肝脏有48个基因调节趋势相反,其中有11个基因在正常饮食条件下都表现为上调,在高脂饮食条件下表现为下调;另有37个基因在正常饮食条件下都表现为下调,而在高脂饮食条件下表现为上调。3) 槲皮素在两种饮食条件下对小鼠肝脏调节趋势一致的40个基因,其调节程度并不相同。4) GO富集分析发现表达趋势一致的基因参与了细胞分泌、突触形成和细胞间信号传导,表达趋势相反的基因与细胞质膜、突触和细胞连接相关。结论:槲皮素对小鼠肝脏基因的调节与小鼠的机体状态有关,不同机体状态其调节作用存在差异。
关键词 :槲皮素,正常饮食,高脂饮食,肝脏,基因表达

Copyright © 2019 by author(s) and Hans Publishers Inc.
This work is licensed under the Creative Commons Attribution International License (CC BY).
http://creativecommons.org/licenses/by/4.0/


1. 引言
槲皮素是一种天然黄酮类化合物,存在于多种药食同源的植物中,可从多种植物中提取获得,已有的研究报道了槲皮素具有多重生物活性,包括抗炎、抗氧化、抗病毒、抗癌活性,并对心脏、肾和骨关节等具有一定的保护作用 [1] [2] [3] 。也有研究报道了槲皮素对肝细胞的保护作用。Hongmei Zeng等研究发现槲皮素通过改善脂肪消耗缓解酒精诱导的肝脏脂质沉积 [4] ,改善肝脏氧化应激 [5] ,槲皮素还能通过抑制炎症小体NLRP3的激活缓解酒精诱导的急性肝损伤 [6] 。另外有研究表明在链霉素诱导的糖尿病大鼠模型中,槲皮素能够改善其肝脏的氧化应激水平和组织学表现,槲皮素干预后肝脏水泡样液化和纤维化面积都减少 [7] [8] 。Nikitin等发现饮食中添加0.1%槲皮素在高果糖饮食能够减轻肝脏的脂质沉积但对炎症和纤维化没有显著的改善作用 [9] 。
现有研究槲皮素药效作用多是在机体疾病状态时下观察其能否改善相关异常指标来纠正疾病状态,从而评估药效作用,对其在正常机体状态下的作用研究的相对较少。本研究通过对比正常机体状态(小鼠正常饮食)和炎性状态(小鼠高脂饮食)时槲皮素调控肝脏基因的异同来阐释槲皮素发挥药效与机体状态的关系。以期为槲皮素预防给药提供依据。
2. 方法
2.1. GEO数据库数据整理
在NIH-Geo数据库(https://www.ncbi.nlm.nih.gov/gds/)中输入关键词“quercetin”和“liver”找到槲皮素干预小鼠肝组织基因表达的两个微阵列数据库,选择特定样本作为槲皮素给药组和未给药平行对照组,样本量均大于3,定义槲皮素给药组为M,未给药平行对照组为C。将所有的基因数据用Excel软件进行分析。将微阵列数据库中的基因与管家基因(Gapdh, Actb)进行比对,选择有显著性变化(p < 0.05)的基因。改变倍数(Fold change)大于2的基因视为上调基因,小于0.5的基因视为下调基因。
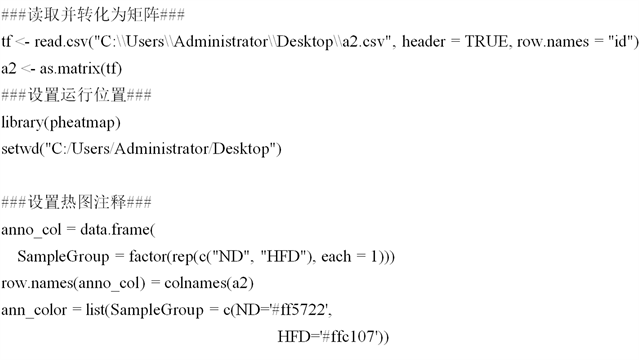
2.2. 运用韦恩图和R语言分析对表达趋势一致的差异基因整理
将两个数据库中槲皮素干预后表达趋势一致(都表现为上调或都表现为下调)的基因进行整理(见图1,表1,表2),将表1、表2中Fold change这列数据分别整理成两列,一列为ND和一列为HFD,并分别将表1和表2整理Fold change 数值的Excel导入到R语言包:
 (a) (b)
Figure 1. Comparison of the commonality of up-regulated and down-regulated genes in liver expression after quercetin intervention in mice on normal diet and high-fat diet
图1. 在正常饮食和高脂饮食条件下槲皮素干预后小鼠肝脏表达上调基因和下调基因共同性比较
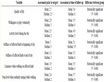
Table 1. The expression of upregulated genes in Normal Diet (ND) and High Fat Diet (HFD) GEO Datasets
表1. 正常饮食和高脂饮食条件下均表现为上调的基因表达
红色标记为上调(Fold change > 2)基因。
Table 2. The expression of downregulated genes in Normal Diet (ND) and High Fat Diet (HFD) GEO Datasets
表2. 正常饮食和高脂饮食条件下都表现为下调的基因表达
绿色标记的为下调(Fold change < 0.5)基因。

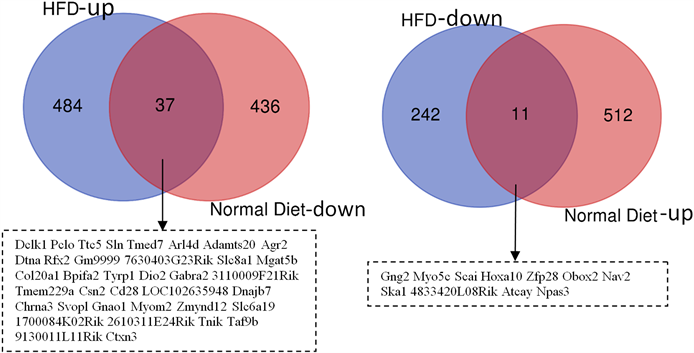
用R语言对其分别做热图分析(见图2),比较各基因表达水平在两种饮食条件下的差异。
 (a) (b)
Figure 2. Heat map shows that regulatory degree of genes which are in same expression tend in liver after treated with quercetin under normal diet and high-fat diet
图2. 槲皮素在两种饮食条件下干预后对小鼠肝脏表达趋势相同的基因调节程度
2.3. 运用韦恩图对表达趋势相反的差异基因整理
将两个数据库中槲皮素干预后表达相反(在一个数据库表现为上调,在另一个数据库中表现为下调)的基因进行整理(见图3,表3,表4)。
2.4. GO富集分析
用David数据库对两个数据库中槲皮素干预后差异基因表达趋势相同(都表现为上调或都表现为下调)以及表达趋势相反的基因进行GO富集分析,整理有显著性差异(P < 0.05)的通路。
3. 结果
GSE62805和GSE38141两个微阵列数据库实验背景除饮食条件不同,其他条件均一致,均是在饲料中添加0.05%的槲皮素干预20周后检测肝脏组织的基因表达谱,模式动物均为C57BL/6J雄性小鼠,两个数据库中空白对照组和槲皮素给药组的样本数均为6 (见表5)。GSE62805是在基础饲料的基础上给以槲皮素而GSE38141在高脂饲料基础上给以槲皮素,整理所得的基因表达差异倍数都是槲皮素给药组与相应空白对照组的比值(GSE62805是槲皮素给药组与基础饲料组的比值,GSE62805是槲皮素给药组与高脂饲料组的比值)。为表述方便,以下结果以正常饮食代表GSE62805微阵列数据,以高脂饮食代表GSE38141数据库。
 (a) (b)
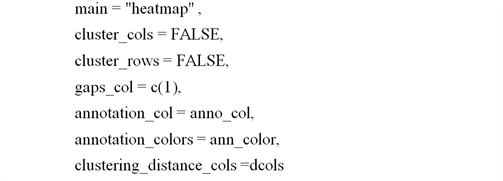
Figure 3. Comparison of up-regulated and down-regulated genes in mice liver after quercetin intervention under normal diet and high-fat diet
图3. 在正常饮食和高脂饮食条件下槲皮素干预后小鼠肝脏上调基因和下调基因差异比较
Table 3. The expression of downregulated genes in Normal Diet (ND) and upregulated genes in High Fat Diet (HFD) GEO Datasets
表3. 槲皮素干预后正常饮食条件下下调而在高脂饮食条件上调的基因的表达谱
红色标记为上调(Fold change > 2)基因,绿色标记的为下调(Fold change < 0.5)基因。
Table 4. The expression of upregulated genes in Normal Diet (ND) and downregulated genes in High Fat Diet (HFD) GEO Datasets
表4. 槲皮素干预后正常饮食条件下表达上调而在高脂饮食条件下调的基因的表达谱
红色标记为表达上调(Fold change > 2)的基因,绿色标记的为表达下调(Fold change < 0.5)的基因。
Table 5. The information of GEO Datasets that were used for the analysis of gene expression in mice liver when treated with quercetin
表5. 分析槲皮素干预后小鼠肝组织基因表达谱的GEO微阵列数据库信息
由结果可以看出在两种饮食条件下管家基因Gapdh和Actb的表达与对照组相比没有显著性的差异(P > 0.05),并且差异倍数接近1 (见表6)。
Table 6. The expression of Housekeeping genes in two GEO Datasets
表6. 微阵列数据库管家基因表达
槲皮素在两种饮食条件下对小鼠肝脏基因表达谱的影响有40个基因调节趋势一致,其中有28个基因在两种饮食条件下都表现为上调(见图1(a)),分别为Gm14781,Ntrk2,Mbd4,Tcaf1,Nefh,Phka2,3110054G05Rik,Dtna,4933424H11Rik,Rgs7bp,4933431M02Rik,Clip4,Prdx6b,1700072H12Rik,Bmpr1b,Timp4,Syt6,Slc5a9,Sncaip,Gm16055,Sgip1,Zfp804a,Txlnb,Foxn4,Adgrl3,C78115,BB236558和Oas1h。另有12个基因在两种饮食条件下均表现为下调(见图1(b)),分别为Cend1,Gabrb2,Agbl4,Trim9,Plekhh2,Prph,Spag16,Zp3r,5033428C03Rik,Tm4sf20,Lrp8和Arpp21。这是槲皮素在两种饮食条件下对小鼠肝脏基因调节的共同之处。
表1和表2分别列出了这40个调节趋势一致的基因具体的差异倍数及P值,表1红色标记的均为表达上调(Fold change > 2)的基因,表2绿色标记的均为表达下调(Fold change < 0.5)的基因。并运用热图分别对上调的基因(见图2(a))和下调的基因(见图2(b))在两种饮食条件下调节幅度进行比较。尽管这些基因在两种饮食条件下调节趋势一致,大部分基因被调节的幅度并不相同。
槲皮素在两种饮食条件下对小鼠肝脏基因的调节作用,其中有48个基因调节趋势相反,其中有11个基因在正常饮食条件下都表现为上调,在高脂饮食条件下表现为下调(见图3(b));另有37个基因在正常饮食条件下都表现为下调,而在高脂饮食条件下表现为上调(见图3(a))。
分别对40个调节趋势一致的基因和48个调节趋势相反的基因进行GO富集分析,发现表达趋势一致的基因参与细胞分泌、突触形成和细胞间信号传导(见图4(a));表达趋势相反的基因与细胞质膜、突触和细胞连接相关(见图4(b))。
4. 讨论
随着生活水平的提高,人们对于食物的选择范围也逐渐变大,整体饮食结构随之改变。有些人喜食
 (a) (b)
Figure 4. The pathways the regulated genes which are in same and opposite expression tend involved in are presented
图4. 两种饮食条件下表达趋势相同的基因参与的通路(A)和表达趋势相反的基因参与的通路(B)
红肉、加工肉类及甜品,其中含有高糖、高脂和高胆固醇,与之相反,有些人坚持清淡饮食,喜食蔬菜、水果和谷类。有研究表明,前一种饮食偏好能够增加2 型糖尿病和心血管疾病的风险,后者则可以降低这一风险 [10] [11] [12] 。2014年,Shivappa等提出“食物炎性系数”的概念,将蔬菜、水果、粗纤维、谷类和某些豆制品归类为抗炎食物,而饱和脂肪酸、反式脂肪酸则被认为是促炎食物 [13] 。基于食物炎性系数这一概念,其研究团队发现促炎饮食能够诱发代谢综合征 [14] ,还发现在爱荷华州女性人群中促炎食物的摄入与代谢综合征时C-反应蛋白的升高和葡萄糖耐受相关 [15] ,在意大利男性人群中促炎饮食是前列腺癌的一个风险因素 [16] 。以上这些研究结果都表明不同的饮食结构塑造了不同的机体炎性状态。
槲皮素是一种天然黄酮类化合物,已有大量研究发现其具有肝脏保护作用 [4] - [9] ,但Aksenov等则发现槲皮素对高果糖诱导的大鼠肥胖的初始阶段并没有表现出显著的肝脏保护作用 [17] ,考虑槲皮素给药剂量不足以纠正高果糖诱导的大鼠肥胖初期的炎性状态。由此,本研究提出科学问题:槲皮素小剂量预防给药在不同的机体状态下的对肝脏基因表达谱的调节是否也存在差异。本研究中正常饮食小鼠组模拟了清淡饮食人群,高脂饮食(饮食中含高脂、高胆固醇和高蔗糖)小鼠组模拟促炎饮食人群。由分析结果可以看出两组小鼠肝脏被调节的基因存在差异,相同的给药剂量由于机体炎性状态不同产生了不同的药效结果。
本研究结果提示在制定给药剂量时可以按照饮食偏好将人群划分为不同的群体,根据人群饮食的炎性系数调整给药剂量,从而实现预期的药效结果。这一研究也为槲皮素的个体化预防给药提供了指导意义。
文章引用
吴诉诉,尚 靖. 对比槲皮素在正常饮食和高脂饮食条件下对小鼠肝脏基因调节的异同
Comparison of the Similarities and Differences of Quercetin on Gene Regulation in Mice Liver under Normal Diet and High-Fat Diet[J]. 药物资讯, 2019, 08(03): 88-98. https://doi.org/10.12677/PI.2019.83011
参考文献
- 1. 王艳芳, 王新华, 朱宇同. 槲皮素药理作用研究进展[J]. 天然产物研究与开发, 2003, 15(2): 171-173.
- 2. Alasmari, A.K., Khan, H.A., Manthiri, R.A., et al. (2018) Protective Effects of a Natural Herbal Compound Quercetin against Snake Venom-Induced Hepatic and Renal Toxicities in Rats. Food & Chemical Toxicology, 118, 105-110. https://doi.org/10.1016/j.fct.2018.05.016
- 3. Zhang, Y., Gao, Z., Liu, J., et al. (2011) Protective Effects of Baicalin and Querce-tin on an Iron-Overloaded Mouse: Comparison of Liver, Kidney and Heart Tissues. Natural Product Research, 25, 1150-1160. https://doi.org/10.1080/14786419.2010.495070
- 4. Zeng, H., et al. (2019) Quercetin Alleviates Ethanol-Induced Liver Steatosis Associated with Improvement of Lipophagy. Food and Chemical Toxicology, 125, 21-28. https://doi.org/10.1016/j.fct.2018.12.028
- 5. Lee, Y.J., Beak, S.Y., Choi, I., et al. (2017) Quercetin and Its Metabolites Protect Hepatocytes against Ethanol-Induced Oxidative Stress by Activation of Nrf2 and AP-1. Food Science and Biotechnology, 27, 809-817. https://doi.org/10.1007/s10068-017-0287-8
- 6. Liu, S., Tian, L., Chai, G., et al. (2018) Targeting Heme Oxygenase-1 by Quer-cetin Ameliorates Alcohol-Induced Acute Liver Injury via Inhibiting NLRP3 Inflammasome Activation. Food & Function, 9, 4184-4193. https://doi.org/10.1039/C8FO00650D
- 7. Senyigit, A., Durmus, S., Mirzatas, E.B., et al. (2018) Effects of Quercetin on Lipid and Protein Damage in the Liver of Streptozotocin-Induced Experimental Diabetic Rats. Journal of Medicinal Food, 22, 52-56. https://doi.org/10.1089/jmf.2018.0030
- 8. Adeoye, A.O., John, O., Daniel, O.O., et al. (2018) Inhibition of Liver Mitochondrial Membrane Permeability Transition Pore Opening by Quercetin and Vitamin E in Streptozotocin-Induced Diabetic Rats. Biochemical and Biophysical Research Communications, 504, 460-469.
- 9. Nikitin, N.S. (2018) Effect of Quercetin on Morphological Changes in Nonalcoholic Fatty Liver Disease in High Fructose-Fed Rats. Voprosy Pitaniia, 87, 16-21.
- 10. Pereira, M.A., Kottke, T.E., Jordan, C., O’Connor, P.J., et al. (2009) Preventing and Managing Cardiometabolic Risk: The Logic for Intervention. International Journal of Environmental Research and Public Health, 6, 2568-2584. https://doi.org/10.3390/ijerph6102568
- 11. van Dam, R.M., Rimm, E.B., Willett, W.C., Stampfer, M.J. and Hu, F.B. (2002) Die-tary Patterns and Risk for Type 2 Diabetes Mellitus in U.S. Men. Annals of Internal Medicine, 136, 201-209. https://doi.org/10.7326/0003-4819-136-3-200202050-00008
- 12. Heidemann, C., Schulze, M.B., Franco, O.H., van Dam, R.M., et al. (2008) Dietary Patterns and Risk of Mortality from Cardiovascular Disease, Cancer, and All Causes in a Prospective Cohort of Women. Circulation, 118, 230-237. https://doi.org/10.1161/CIRCULATIONAHA.108.771881
- 13. Shivappa, N., Steck, S.E., Hurley, T.G., et al. (2014) Designing and Developing a Literature-Derived, Population-Based Dietary Inflammatory Index. Public Health Nutrition, 17, 1689-1696. https://doi.org/10.1017/S1368980013002115
- 14. Wirth, M.D., Burch, J., Shivappa, N., et al. (2014) Association of a Dietary Inflammatory Index with Inflammatory Indices and Metabolic Syndrome among Police Officers. Journal of Occupational and Envi-ronmental Medicine, 56, 986-989. https://doi.org/10.1097/JOM.0000000000000213
- 15. Shivappa, N., Prizment, A.E., Blair, C.K., et al. (2014) Dietary Inflammatory Index (DII) and Risk of Colorectal Cancer in Iowa Women’s Health Study. Cancer Epidemi-ology, Biomarkers & Prevention, 23, 2383-2392. https://doi.org/10.1158/1055-9965.EPI-14-0537
- 16. Shivappa, N., Bosetti, C., Zucchetto, A., et al. (2015) Association between Dietary Inflammatory Index and Prostate Cancer among Italian Men. British Journal of Nutrition, 113, 278-283. https://doi.org/10.1017/S0007114514003572
- 17. Aksenov, I.V. (2018) Effects of Quercetin on Protective Capacity in Rats Fed a High-Fructose Diet. Voprosy Pitaniia, 87, 6-12.