Statistics and Application
Vol.
08
No.
05
(
2019
), Article ID:
32670
,
7
pages
10.12677/SA.2019.85088
Large Precision Matrix Estimation for Compositional Data
Xuanxuan Zhang, Fengxia He
School of Mathematics and Physics, North China Electric Power University, Beijing

Received: Oct. 2nd, 2019; accepted: Oct. 18th, 2019; published: Oct. 25th, 2019

ABSTRACT
High-dimensional compositional data arise in many applications, and statistical methods often fail to produce sensible results due to the unit-sum constraints. The estimation of high dimensional covariance matrix or precision (inverse covariance) matrix is the basic problem of modern multivariate analysis. In this paper, the precision matrix estimation problem for high-dimensional compositional data is considered. It is known that the inverse of the sample covariance matrix is unstable for the estimate precision matrix. Since the sample size of the data is smaller than the number of variables, the inverse of the high-dimensional data matrix is difficult to estimate. In this paper, we use the centered log-ratio transformation method to process high-dimensional compositional data, and then solve the singularity problem of covariance matrix, and obtain the precision matrix estimation of high-dimensional compositional data. Simulation experiments and actual data can verify the rationality of the proposed method.
Keywords:Compositional Data, High-Dimensional Data, Centered Log-Ratio Transformation, Precision Matrix
高维成分数据的精度矩阵估计
张轩轩,何凤霞
华北电力大学数理学院,北京
收稿日期:2019年10月2日;录用日期:2019年10月18日;发布日期:2019年10月25日

摘 要
高维成分数据在许多应用中均有出现,由于定和约束,统计方法通常不能产生合理的结果。高维协方差矩阵和精度(逆协方差)矩阵的估计是现代多元分析的基本问题,本文考虑高维成分数据的精度矩阵估计问题。已知样本协方差矩阵求逆对于估计精度矩阵是不稳定的,由于数据的样本量小于变量个数,高维数据矩阵的逆很难估计。本文利用中心对数比变换方法,处理高维成分数据,然后解决协方差矩阵奇异性问题,得到高维成分数据的精度矩阵估计。模拟实验和实际数据可以验证提出方法的合理性。
关键词 :成分数据,高维数据,中心对数比变换,精度矩阵

Copyright © 2019 by author(s) and Hans Publishers Inc.
This work is licensed under the Creative Commons Attribution International License (CC BY).
http://creativecommons.org/licenses/by/4.0/


1. 引言
成分数据经常出现在地质、微生物、经济等许多领域,例如岩石的化学成分,家庭支出模式,生物群落的物种组成等等,它主要是用来研究构成某个整体的各部分的比重关系。1866年Ferrers [1] 首先提出了成分数据的概念。Aitchison [2] 指出研究成分数据应该关注这些成分间的比例关系,而不应该过多地关注每一个分量的具体取值是多少。之后Aitchison [3] [4] 提出了一种新的处理成分数据的方法“对数比”,使得传统的统计方法也能够对变换后的数据进行相应的统计分析。除了对数比变换,还有等距对数比变换 [5] ,球坐标变换 [6] 等。
估计协方差矩阵是多变量分析的基础。非成分高维数据的协方差和精度(协方差的逆)矩阵估计的方法已逐渐成熟。对于协方差估计,Bickel和Levina [7] 提出硬阈值方法研究高维协方差的估计。Rothman、Levina和Zhu [8] 研究了一类更普通的阈值方法。Cai和Liu [9] 提出了自适应阈值方法,该方法可以根据数据选择阈值,方法的灵活度更高。对于精度矩阵估计,Friedman、Hastie和Tibshirani [10] 提出了一种有效的算法(Graphical lasso)估计高维精度矩阵。Cai、Liu和Luo [11] 在矩阵求逆约束下寻找稀疏精度矩阵。除此之外,我们还参考了Liu和Luo [12] 和Fan、Liao和Liu [13] 等文章。上面的文章都是关于非成分数据的,对于成分数据的研究比较少。Cao、Lin和Li [14] 提出自适应阈值方法估计协方差矩阵。但这种方法只研究了协方差矩阵,没有研究精度矩阵估计。我们将提出一种方法研究精度矩阵。我们首先将数据进行中心对数比变换,得到成分数据的协方差矩阵,然后借鉴稀疏列式逆算子方法得到高维成分数据精度矩阵。本文具体安排如下。第一部分,给出了基本符号和定义,并且介绍高维成分数据精度矩阵估计方法。第二部分和第三部分进行模拟实验和实际数据分析。
2. 方法
2.1. 记号
我们首先介绍一些符号。在本文中,对于向量 ,定义 ,。对于矩阵 ,定义矩阵谱范数 ,矩阵Frobenius范数 ,矩阵无穷范数 。 表示最大特征值, 表示最小特征值,A的转置用 表示, 是指示函数。
2.2. 方法
令 ,其中 是p维成分数据, 为 维单形空间。对成分数据做对数比变换,把成分单形空间映射到欧几里得空间中,从而使经典的统计方法可以适用于变换后的数据。在此我们采用中心对数比变换:
(1)
是X的几何均值。
定义中心对数比协方差矩阵
(2)
从而,我们得到中心对数比协方差矩阵 。
对于成分数据协方差矩阵 ,Cao、Lin和Li [14] 建议用中心对数比协方差矩阵 代替协方差矩阵 ,这极大地促进了新方法和相关理论的发展。
如果 是非奇异的,对于精度矩阵 ,我们有 。令 , 表示精度矩阵的第i列, 是单位矩阵的第i列,则 ,即 。为了解决高维协方差矩阵奇异性问题,即当样本量小于变量个数,样本协方差矩阵不是满秩的,对于高维成分数据的样本中心对数比协方差矩阵 ,此时我们考虑列损失函数
(3)
其中 。
是正定的,则 是凸函数,当损失函数趋于0时,损失函数越小,B越趋近 。
为了解决精度矩阵的稀疏性,我们加 惩罚到列损失函数,使 中的一些坐标尽可能为0,即
(4)
令 是下式的解
(5)
则 ,其中
其中 是单位矩阵的第i列, 是调整参数,参见文献 [12] 。
对于 的选择,基于H折交叉验证,我们定义 通过除第v折外的样本得到, 为第v折样本协方差矩阵, ,其中H是一个固定的整数。 划分区间 ,其中 。
(6)
使用最优 ,然后基于完整数据集计算得到最终估计。
综上,我们可以得到高维成分数据的精度矩阵估计
其中 。
3. 数值模拟
我们按照Cao、Lin和Li [14] 生成数据 。以下面2种方式得到 :
方式1: 独立于多元正态分布
方式2: ,其中 ,,矩阵F可以通过奇异值分解得到( , )。这2种方式中,我们从 上的均匀分布中随机取出 的分量。
, (7)
这样我们就得到了 ,。
对于 ,我们通过以下2个模型得到:
模型1: ;
模型2: ,其中 ,,,。
我们取 ,而B是一个对称矩阵,它的下三角元素独立于值为 的概率为0.2,值为0的概率为0.8的均匀分布。
在2种模型下,我们比较了不同变换 ,样本Y, 和通过其变换得到的精度矩阵估计量 ,, 的优劣。其中 是理想估计量,而 忽略成分数据的独特特征,表现不佳。我们考虑以不同变换下的样本相关性,谱范数和Frobenius范数等性能指标来比较方法的优劣。
对于模型1,我们考虑样本相关性。取样本大小 ,样本维数 , 和 时进行模拟。
从图1和图2可以看出, 样本相关关系以0为中心,与Y的样本相关关系分布类似,并且相似度随着维数p的增大而增大。而 上观察到了伪相关现象, 的样本相关性出现了向上的偏移。可见中心对数比变换( )处理高维成分数据具有优越性。
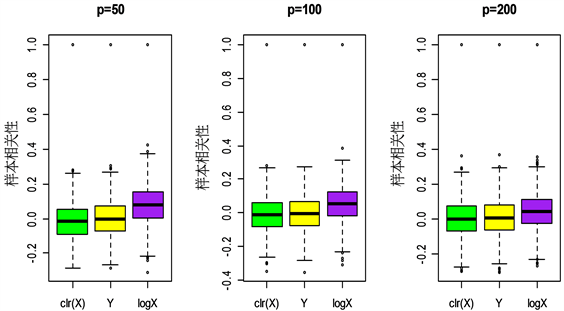
Figure 1. Boxplots of sample correlation under different transformations in mode 1
图1. 由方式1得到的不同变换下的样本相关性箱型图
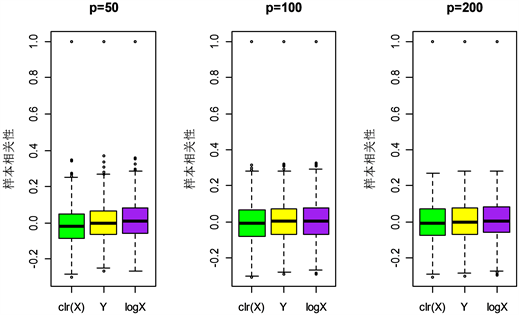
Figure 2. Boxplots of sample correlation under different transformations in mode 2
图2. 由方式2得到的不同变换下的样本相关性箱型图
对模型2下的精度矩阵的性能进行研究,我们取样本大小 ,样本维数 , 和 ,进行500次模拟,然后给出模拟结果均值。
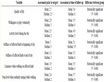
Table 1. The precision matrix performance index under different transformations obtained in mode 1
表1. 由方式1得到的不同变换下精度矩阵性能指标
Table 2. The precision matrix performance index under different transformations obtained in mode 2
表2. 由方式2得到的不同变换下精度矩阵性能指标
表1和表2比较了不同变换下的精度矩阵的谱范数和Frobenius范数,无论是谱范数还是Frobenius范数, 与理想估计 的性能指标几乎一致,从而验证我们提出方法的合理性。
4. 与炎症性肠病(IBD)相关的细菌物种数据集分析
IBD数据集收集了85例IBD病例的粪便样本和26个正常对照样本,并对每个样品进行宏基因组测序,从而鉴定出总共97种细菌物种 [15] 。对于数据集中的零元素,在不超过数据生成过程中的最小探测精度的条件下,我们取10−3。取正常样本( )的1/5,病例样本( )的1/5组成测试集,其他样本组成训练集。然后我们对数据集进行线性判别分析,其分析模型可以参见文献 [11] 。
(8)
其中 ,。 为分类标准,分类性能与 的估计精度密切相关。
我们对IBD数据集进行分类,用TPR (真正类率),FPR (假正类率),MCC (马修斯相关系数)来评估分类的情况。
, (9)
(10)
其中TP代表真阳性(正常),TN代表真阴性(病例),FP代表假阳性,FN代表假阴性。
Table 3. Classification performance result
表3. 分类性能结果
从表3中,我们可以看出,我们的判别分析方法对该数据集的分类性能较好,可以得出高维成分数据的精度矩阵估计 对实际数据的处理性能良好。
5. 结语
本文通过对高维成分数据的分析和处理,得到了高维成分数据的精度矩阵估计方法,对高维成分数据的研究具有一定的实际意义。协方差仅刻画了两个分量间相关性大小,不能衡量二者的直接关联性,研究某些问题时,如微生物菌种问题,研究人员往往对菌种间的直接相互作用更感兴趣,而精度矩阵可以衡量两个菌种间的直接相互作用。并且本文通过模拟实验和IBD数据集验证了该方法的合理性,可以较好的处理高维成分数据。但对精度矩阵稀疏性和可识别性还需要进一步的研究和讨论。
基金项目
教育部人文社会科学研究规划基金项目(18YJA880077)。
文章引用
张轩轩,何凤霞. 高维成分数据的精度矩阵估计
Large Precision Matrix Estimation for Compositional Data[J]. 统计学与应用, 2019, 08(05): 777-783. https://doi.org/10.12677/SA.2019.85088
参考文献
- 1. Ferrers, N.M. (1866) An Elementary Treatise on Trilinear Coordinates. Macmillan, London.
- 2. Aitchison, J. (1968) The Statistical Analysis of Compositional Data. Chapman and Hall, London.
- 3. Aitchison, J. (1994) A Concise Guide to Compositional Data Analysis. Institute of Mathematical Statistics Lecture Notes—Monograph Series, Vol. 24, 73-81. https://doi.org/10.1214/lnms/1215463786
- 4. Aitchison, J. and Egozcue, J.J. (2005) Compositional Data Analysis: Where Are We and Where Should We Be Heading. Mathematical Geology, 37, 829-850. https://doi.org/10.1007/s11004-005-7383-7
- 5. Egozcue, J.J., Pawlowsky-Glahn, V., Mateu-Figueras, G., et al. (2003) Isometric Logratio Transformations for Compositional Data Analysis. Mathematical Geology, 35, 279-300. https://doi.org/10.1023/A:1023818214614
- 6. Wang, H., Liu, Q., Henry, M.K., et al. (2007) A Hyperspherical Transformation Forecasting Model for Compositional Data. European Journal of Operational Research, 179, 459-468. https://doi.org/10.1016/j.ejor.2006.03.039
- 7. Bickel, P.J. and Levina, E. (2008) Covariance Regularization by Thresholding. Annals of Statistics, 36, 2577-2604. https://doi.org/10.1214/08-AOS600
- 8. Rothman, A.J., Levina, E. and Zhu, J. (2009) Generalized Thresholding of Large Covariance Matrices. Journal of the American Statistical Association, 104, 177-186. https://doi.org/10.1198/jasa.2009.0101
- 9. Cai, T. and Liu, W. (2011) Adaptive Thresholding for Sparse Covariance Matrix Estimation. Journal of the American Statistical Association, 106, 672-684. https://doi.org/10.1198/jasa.2011.tm10560
- 10. Friedman, J., Hastie, T. and Tibshirani, R. (2008) Sparse Inverse Covariance Estimation with the Graphical Lasso. Biostatistics, 9, 432-441. https://doi.org/10.1093/biostatistics/kxm045
- 11. Cai, T., Liu, W. and Luo, X. (2011) A Constrained L1 Minimization Approach to Sparse Precision Matrix Estimation. Journal of the American Statistical Association, 106, 594-607. https://doi.org/10.1198/jasa.2011.tm10155
- 12. Liu, W. and Luo, X. (2015) Fast and Adaptive Sparse Precision Matrix Estimation in High Dimensions. Journal of Multivariate Analysis, 135, 153-162. https://doi.org/10.1016/j.jmva.2014.11.005
- 13. Fan, J., Liao, Y. and Liu, H. (2016) An Overview of the Estimation of Large Covariance and Precision Matrices. The Econometrics Journal, 19, C1-C32. https://doi.org/10.1111/ectj.12061
- 14. Cao, Y., Lin, W. and Li, H. (2018) Large Covariance Estimation for Compositional Data via Composition-Adjusted Thresholding. Journal of the American Statistical Association, 114, 759-772.
- 15. Lu, J.R., Shi, P.X. and Li, H.Z. (2018) Generalized Linear Models with Linear Constraints for Microbiome Compositional Data. Biometrics.