Climate Change Research Letters
Vol.
09
No.
03
(
2020
), Article ID:
35280
,
5
pages
10.12677/CCRL.2020.93021
Contrastive Analysis of Temperatures at North and South Runways of Xi’an Airport
Gaojie Zhang, Aimin Dong, Xiaoxi Qiang, Yijia Qian
Meteorological Center of Northwest Regional Air Traffic Management Bureau, Xi’an Shaanxi

Received: Apr. 6th, 2020; accepted: Apr. 20th, 2020; published: Apr. 27th, 2020

ABSTRACT
Based on the hourly temperature data of the south and north runways of Xi’an Airport, the characteristics of the temperature difference between the two runways are compared and analyzed. The results show that the average temperature of the south runway is higher than that of the north runway. From the perspective of daily changes, the maximum temperature difference between the two appears at 15 UTC, the temperature difference is 3.4˚C, and the minimum appears at 10 UTC, the temperature difference is 2˚C. In terms of monthly changes, the maximum temperature difference of the average temperature and the minimum temperature appears in December, and the maximum temperature difference of the maximum temperature appears in July. The minimum temperature difference of the monthly average temperature, the maximum monthly temperature, and the minimum monthly temperature appear in September, October, and July. The maximum hourly temperature difference between the north and south runways is concentrated from December to January, and the minimum value is concentrated from June to September.
Keywords:Xi’an Airport, South and North Runway, Temperature Comparison

西安机场南北跑道气温对比分析
张高杰,董爱民,强晓西,钱一嘉
中国民用航空西北地区空中交通管理局气象中心,陕西 西安

收稿日期:2020年4月6日;录用日期:2020年4月20日;发布日期:2020年4月27日

摘 要
基于西安机场南北跑道逐小时气温资料,对两跑道温差的变化特征进行了对比分析。结果表明:南跑道平均气温高于北跑道;日变化来看,两者温差最大值出现在15时(UTC),温差为3.4℃;最小值出现在10时(UTC),温差为2℃。月变化来看,平均气温、最低气温月平均气温温差最大值均出现在12月,最高气温月平均气温温差最大值出现在7月;平均气温、最高气温、最低气温月平均气温温差最小值分别出现在9月、10月和7月。南北跑道逐时温差最大值集中分布在12月~次年1月,最小值集中分布在6~9月。
关键词 :西安机场,南北跑道,气温对比

Copyright © 2020 by author(s) and Hans Publishers Inc.
This work is licensed under the Creative Commons Attribution International License (CC BY 4.0).
http://creativecommons.org/licenses/by/4.0/


1. 引言
气温是影响飞行的重要气象要素。气温越高,气压越低,空气密度越小,机翼产生的升力越小,起飞滑跑的距离越长。气温高于标准大气温度时,会增加飞机起飞滑跑距离和上升爬高时间,降低飞机载重量。此外,雷暴、跑道结冰状况、霜冻等航危天气都与气温高低密切相关,机场温度预报是现有航空气象服务的重要一部分。许多学者对所在机场的温度变化特征进行了分析 [1] [2] [3],也有部分学者针对温度对放行的影响进行了相应的研究 [4] [5]。但是,由于温度变化特征具有地域性特点,统计结果往往仅适用于当地机场。另外,以往的统计分析往往仅针对机场的平均温度,没有分跑道进行研究分析。在实际业务工作中发现,西安机场南北跑道的探测温度存在一定的差异,给机场温度的预报和服务造成一定的困难。本文旨在对西安机场南北两跑道温度差值的变化情况进行统计分析,为西安机场的温度预报提供参考,进而为签派放行提供温度依据,提高放行正常率。
2. 资料和方法
西安机场现有南北两个飞行区,两条南北平行跑道分别为23跑道和05跑道,两者相距约2100米。2012年6月份开始,西安机场开始实行双跑道运行,考虑到数据的稳定性,选取2013~2018年逐小时的10分钟平均气温数据作为研究对象。西安机场目前采用北跑道南端(05L)作为基准观测点,用该点的测量温度作为西安机场的代表温度,因此本文选取北跑道南端(05L)探测温度作为北跑道的代表温度,对应的选取南跑道南端(05R)的探测温度作为南跑道的代表温度。
3. 南北跑道温度差变化特征
3.1. 日变化特征
图1为西安机场南北跑道平均气温差的日变化特征。从图中可以看出,南跑道平均气温始终高于北跑道,两者之间逐小时平均温差在2℃~4℃。南北跑道温差日变化基本呈现单峰型的分布特征,两者温差最大时段分布在午夜前后(13~18时(UTC,下同)),温差基本在3℃以上,最大值发生在15时,温差达3.4℃;19时~次日12时,两跑道温差低于3℃,最低值出现在10时,温差为2℃。
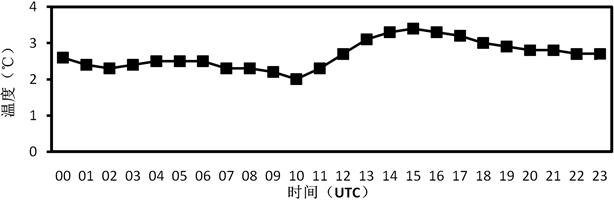
Figure 1. Diurnal variation of mean temperature difference (05R - 05L) between south and north runways of Xi’an Airport
图1. 西安机场南北跑道平均气温差(05R~05L)日变化
3.2. 月变化特征
在航空气象服务中,除了要预报机场的平均温度外,还需要预报机场的最高温度和最低温度。图2给出了西安机场南北跑道平均气温、最高气温、最低气温温差的月变化特征。整体来看,最低气温温差的月变化幅度要明显高于平均气温和最低气温的温差,其中最高气温温差的变化幅度最小。平均气温、最低气温温差均呈现单峰型的分布特征,温差最大值位于12月,分别为3.8℃和5.2℃;最高气温温差呈现双峰型的分布特征,温差在7月和12月有两个峰值,温差最大值位于7月,为3.2℃。最高气温、最低气温和月平均气温温差最小值分别出现在9月、10月和7月,温差分别为1.9℃、1.3℃和2.7℃。
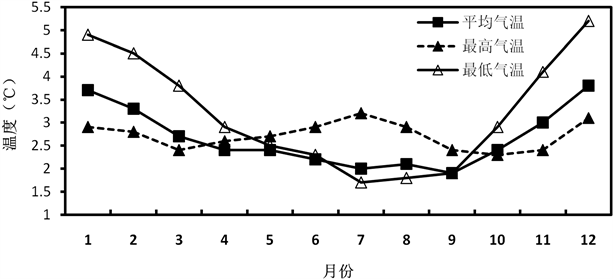
Figure 2. Monthly variation of temperature difference (05R - 05L) between south and north runways of Xi’an Airport
图2. 西安机场南北跑道气温差(05R~05L)月变化
3.3. 逐月日变化特征
考虑到气温往往具有明显的月变化特征,可能对温差日变化造成影响。表1给出了西安机场南北跑道温差的逐月日变化数值。可以看出西安机场南北跑道逐时温差最大值集中分布在12月~次年1月,温差均在2℃以上;最小值集中分布在6~9月,温差均在3℃以内。从日变化特征来看,3~9月温差最小值出现在09~10时,10月~次年3月温差最小值出现在11~12时;温差最大值集中分布14时和15时,7月和8月温差最小值出现在08时,6月最低值出现在16时。
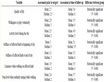
Table 1. Diurnal variation of monthly temperature difference (05R - 05L) between the south and north runways of Xi’an Airport
表1. 西安机场南北跑道气温差(05R~05L)逐月日变化
4. 结论与讨论
1) 西安机场南跑道平均温度高于北跑道;南北跑道日温差最大值出现在15时,温差为3.4℃,最小值出现在10时,温差为2℃;
2) 南北跑道平均气温、最低气温月平均温差最大值均出现在12月,温差分别为3.8℃、5.2℃,最高月平均气温温差最大值出现在7月,温差为3.2℃;三者最小值分别出现在9月、10月和7月,温差分别为1.9℃、1.3℃和2.7℃。
3) 南北跑道逐时温差最大值集中分布在12月~次年1月,温差均大于2℃;最小值集中分布在6~9月,温差均在3℃以内。3~9月温差最小值出现在09~10时,10月~次年3月温差最小值出现在11~12时。
4) 本文只是对西安机场南北跑道温度差的变化特征进行了统计分析,造成这种变化特征的原因还有待进一步分析研究。
文章引用
张高杰,董爱民,强晓西,钱一嘉. 西安机场南北跑道气温对比分析
Contrastive Analysis of Temperatures at North and South Runways of Xi’an Airport[J]. 气候变化研究快报, 2020, 09(03): 177-181. https://doi.org/10.12677/CCRL.2020.93021
参考文献
- 1. 朱蕾. 乌鲁木齐机场近50a温度变化特征分析[J]. 干旱气象, 2004(4): 34-39.
- 2. 黎克. 呼和浩特市白塔机场温度变化对比分析[J]. 内蒙古气象, 2006(1): 14-15.
- 3. 李芊杉, 张序, 叶楠. 温度对航班签派放行影响的分析——以广元盘龙机场起飞为例[J]. 成都航空职业技术学院学报, 2018, 34(4): 45-48.
- 4. 张序, 罗凤娥, 李家南, 李芊杉. 广元盘龙机场温度天气事件下签派放行研究[J]. 航空科学技术, 2018, 29(11): 43-49.
- 5. 曾祥耀. 兰州机场1996~2010年夏季最高温度变化特征分析[J]. 科技风, 2019(29): 140+151.