Hans Journal of Ophthalmology
Vol.
10
No.
02
(
2021
), Article ID:
43592
,
9
pages
10.12677/HJO.2021.102011
应用光学相干断层扫描血流成像 技术分析青光眼的 微循环变化
黄丽娜1,2*,李强3,黄 鹏4,林 晨3,5,张志强1,段阗阗1,何芬1,曾东汇1
1暨南大学附属深圳爱尔眼科医院,广东 深圳
2暨南大学附属深圳眼科医院,广东 深圳
3深圳市人民医院,广东 深圳
4深圳大学医学院,广东 深圳
5中南大学爱尔眼科学院,湖南 长沙

收稿日期:2021年5月29日;录用日期:2021年6月13日;发布日期:2021年6月30日

摘要
目的:应用光学相干断层扫描血流成像(optical coherence tomography angiography, OCTA)技术定性定量分析原发性开角型青光眼(primary open angle glaucoma, POAG)黄斑区及视盘旁的微循环变化特点,探讨各期开角型青光眼患者黄斑区与视盘旁的微循环变化与视网膜结构损伤与视野损害的关系。方法:选取2018.04~2019.04就诊于深圳爱尔眼科医院确诊为POAG且眼压控制稳定的患者41人(共77眼,其中早期35眼、进展期25眼、晚期17眼)为观察组,选择年龄、性别配对的正常人群23例(43眼)为对照组。应用OCTA技术分别测量黄斑区各象限以及视盘旁平均毛细血管密度,分析其黄斑区及视盘旁微循环变化;同时应用OCT分别测量黄斑区节细胞复合体(retinal ganglion cells, GCC)和视盘旁视网膜神经纤维层(retinal nerve fiber layer, RNFL)平均厚度,并研究各参数与视野MD值的相关性。结果:POAG患者存在眼底微循环异常,黄斑区及视盘旁毛细血管密度低于正常眼,而且随着病情进展,黄斑区(全周、上方、下方)及视盘(全周、上方、下方)毛细血管密度明显减少,且与患眼RNFL和视野的损害有较好的相关性。结论:随着青光眼的进展,视盘及黄斑区的上方与下方微血管微循环容易出现异常而表现相应微血管密度降低。青光眼的严重程度与血管密度有一定关联。
关键词
光学相干断层扫描血流成像,开角型青光眼,毛细血管密度,神经节细胞复合体,视神经纤维层厚度,24-II视野

Analysis of Microcirculation Changes in the Macular Area and Optic Disc of Primary Open-Angle Glaucoma Using Optical Coherence Tomograph Angiography
Lina Huang1,2*, Qiang Li3*, Peng Hang4, Chen Lin3,5, Zhiqiang Zhang1, Tiantian Duan1, Fen He1, Donghui Zeng1
1Shenzhen Aier Eye Hospital, Jinan University, Shenzhen Guangdong
2Shenzhen Eye Hospital Affiliated to Jinan University, Shenzhen Guangdong
3Shenzhen People’s Hospital, Shenzhen Guangdong
4School of Medicine, Shenzhen University, Shenzhen Guangdong
5Aier School of Ophthalmology, Central South University, Changsha Hunan

Received: May 29th, 2021; accepted: Jun. 13th, 2021; published: Jun. 30th, 2021

ABSTRACT
Objective: Qualitatively and quantitatively analyze the characteristics of microcirculation changes in the macular area and the optic disc of primary open angle glaucoma (POAG) using optical coherence tomography angiography (OCTA). To investigate the relationship between the microcirculation changes and the structural damage in the macular area and the optic and visual field damage in patients with POAG at various stages. Methods: The subjects selected from 2018-04 to 2019-04 who were treated at Shenzhen Aier Eye Hospital. 41 patients (77 eyes; in which, 35 eyes with mild glaucoma, 25 eyes with moderated glaucoma and 17 eyes with advanced glaucoma) with POAG and stable intraocular pressure control were enrolled in the observation group. 23 subjects (43 eyes) with matched age and gender were selected as normal group. OCTA technique was used to measure the macular area and the optic disc. The average capillary density of each quadrant was qualitatively and quantitatively analyzed for the characteristics of the macular area and the microcirculation of the optic disc. Cirrus OCT was also used to measure the macular ganglion cell complex (GCC) and the retinal nerve fiber layer (RNFL), Humphrey-HFA3 (24-II) was used to test the visual field of each patient, and the correlation between OCTA parameters and visual field were also analyzed. Results: Abnormal fundus microcirculation was found in the patients with POAG. Capillary density in the macular area and optic disc zone was lower than the normal eyes. With the progression of glaucoma, the capillary density of macular area (total area, upper and lower quadrant) and the optic disc zone (full circumference, upper, lower) decreased. The capillary density correlated with the RNFL thickness and MD value of visual field (p < 0.05). Conclusions: As glaucoma progresses, the vascular microcirculation showed abnormalities. The microvessel density reduced in the area of macular area and optic disc zone. The severity of glaucoma is related to the decline of capillary density.
Keywords:Optical Coherence Tomography Angiography, Open Angle Glaucoma, Capillary Density, Ganglion Cell Complex, Retinal Nerve Fiber Layer Thickness, Visual Field

Copyright © 2021 by author(s) and Hans Publishers Inc.
This work is licensed under the Creative Commons Attribution International License (CC BY 4.0).
http://creativecommons.org/licenses/by/4.0/


1. 引言
青光眼是世界第二大不可逆的严重致盲眼病 [1],是一组以视网膜神经节细胞(retinal ganglion cell, RGC)损伤及其轴突进行性丢失和视网膜神经纤维层(retinal nerve fiber layer, RNFL)不可逆性损害为主要特征的视神经病变 [2] [3] [4];青光眼的早期诊断尤为重要。传统青光眼诊断的金标准是标准自动视野检查,但其早期诊断的敏感性不足。有研究提示青光眼患者中可能存在微血流的异常。近年出现的光学相干断层扫描血流成像(optical coherence tomography angiography, OCTA)是基于OCT系统的基础上开发出的一种无损技术对视网膜血流进行成像。本研究拟运用OCTA技术研究各期青光眼患者中黄斑及视盘旁区域的微血流变化。
2. 材料与方法
2.1. 实验对象及分组
选取2018.04-2019.04就诊于深圳爱尔眼科医院确诊为POAG且眼压控制稳定的患者41人(共77眼,其中早期35眼、进展期25眼、晚期17眼)为观察组,参照Hodapp分级,依据视野检查中的MD值将青光眼分为早期青光眼组(MD > −6 dB) 35眼、进展期青光眼(−6 dB > MD > −12 dB) 25眼、晚期青光眼(MD ≤ −12dB)17眼。选择年龄、性别配对的正常人群23例(43眼)为对照组(见表1)。
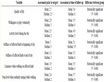
Table 1. Comparison and grouping of basic characteristics of research objects
表1. 研究对象的基本特征比较及分组
n, number of eyes.
2.2. 眼科常规检查,视野及OCT检查
所有受试者除了接受视力、裂隙灯、Goldman压平式眼压以外,还接受了Humphery-HFA3视野计(Carl Zeiss Meditec。德国,中心24-II全阈值程序SITA-Standard)以及Cirrus HD-OCT的视盘及黄斑区检查(Cirrus HD-OCT400,Carl Zeiss,模式:Optic Disc Cube 200*200以及Macular Cube 512*128)。
2.3. OCTA的视盘及黄斑区血管密度检查
使用RTVue-XR Avanti频域OCTA (Optovue Inc, software Version)对所有入组的研究对象的两只眼进行扫描。检查项目包括视盘辐射状毛细血管(radial peripapillary capillaris, RPC)平均密度检查、黄斑区毛细血管平均密度检查。黄斑区扫描范围为6 × 6 mm2,然后通过软件自带的运动矫正软件对眼动进行校正后获得黄斑区微血管图。选取以黄斑中心凹为中心直径1 mm圆和3 mm旁中心圆环内密度进行分析,以百分比(%)表示。视盘周围毛细血管密度检查采用以视盘为中心进行栅栏状扫描模型(4.5 × 4.5 mm,Angio Disc扫描模式),操作由同一名专业技术员完成,采集图像后,获取视盘周围辐射状毛细血管(radial peripapillary capillaris, RPC)的血管分布情况。选择信号强度评分在6以上、图像清晰、无断层的OCTA图片,使用机器自带软件进行密度计算,由内置软件自动分析生成黄斑区及视盘全周以及各象限平均毛细血管密度。
2.4. 统计学分析
本数据利用SPSS 24.0软件进行统计学分析;计量数据的表示为平均值±标准差( ),采用两样本比较的t检验(两组比较)或者单因素方差分析(多组比较)对不同分组(早期青光眼组、进展期青光眼组、晚期青光眼组和正常对照组)的研究对象视盘及黄斑区血流参数等指标进行对比。使用Pearson线性相关分析对视盘血管参数与视野平均缺损度及视盘RNFL厚度的相关性进行分析。以P < 0.05为差异有统计学意义。
3. 结果
3.1. 各组受试者OCTA检查结果
各分组受试者的视盘RNFL厚度、黄斑区GCC厚度、视野、视盘及黄斑区平均毛细血管密度如表2所示。其中各组的结果两两比较均有显著统计学差异(P < 0.001)。图1为4名各期青光眼患者及一名正常对照组的OCTA、眼底视盘照相、视野模式偏差图的检查结果。随青光眼的进展,视盘及黄斑区域的平均毛细血管密度逐步降低。
3.2. 原发性开角型青光眼患者受检眼黄斑区平均毛细血管密度与黄斑区GCC平均厚度及视野MD值的关系
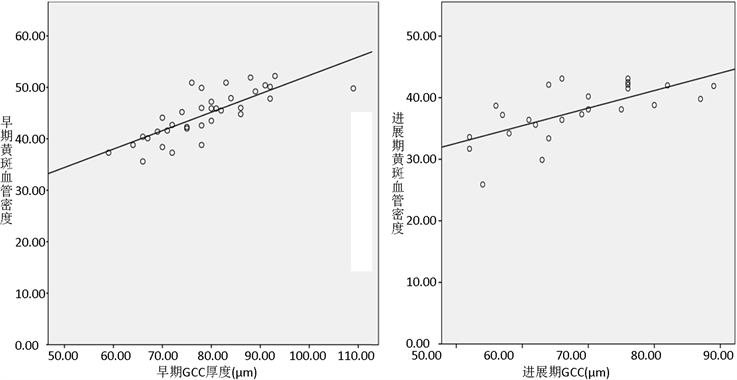
经Pearson线性相关回归分析,全部受检眼的黄斑区毛细血管平均密度与黄斑区GCC平均厚度呈正相关(r = 0.827, P < 0.05),与视野MD结果呈正相关(r = 0.731, P < 0.05)。分别对早期、进展期和晚期青光眼各组受试者进行分组检验,黄斑区毛细血管平均密度,与黄斑区平均GCC厚度均呈正相关(r = 0.781, 0.677, 0.582, P < 0.05);早期青光眼组黄斑区毛细血管密度与视野MD值呈正相关(r = 0.353, P < 0.05);但进展期和晚期青光眼组黄斑区毛细血管密度与视野MD值呈相关性无明显统计学意义(P > 0.05)。见图2。
3.3. OCTA毛细血管密度参数对开角型青光眼诊断效能
采用ROC曲线下面积(ROC-AUC)分析黄斑区平均毛细血管密度、视盘周围平均毛细血管密度对青光眼的诊断效能。其中视盘全周平均毛细血管密度的ROC-AUC为0.836,视盘上方平均毛细血管密度ROC-AUC为0.788,视盘下方平均毛细血管密度ROC-AUC为0.836,黄斑区平均毛细血管密度ROC-AUC为0.852。OCTA的视盘及黄斑血管密度参数对青光眼具有较高的诊断效能。见图3。
Table 2. Comparison of the results of OCTA examination in each group
表2. 各分组受试者的OCTA检查结果
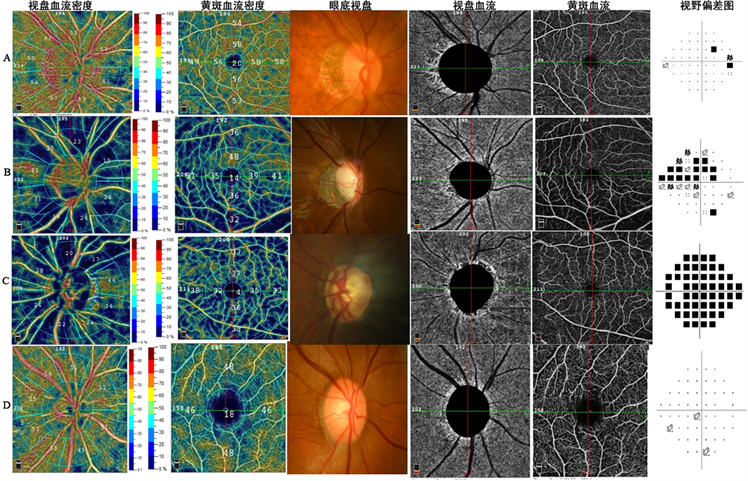 A:37岁男性,早期青光眼,视野MD = −4.70dB ,视盘血管密度为46.7%,黄斑血管密度为50.9%。平均RNFL厚度83 um,平均GCC厚度83 um。B:27岁男性,进展期青光眼,视野MD = −8.20dB,视盘血管密度为32.4%,黄斑血管密度为34.2%。平均RNFL厚度50 um,平均GCC厚度60 um。C:46岁女性,晚期青光眼,视野MD = −31.95 dB,视盘血管密度为27.9%,黄斑血管密度为34.0%。平均RNFL厚度49 um,平均GCC厚度50 um。D:26岁女性,正常眼,视野MD = +0.75 dB,视盘血管密度为48.8%,黄斑血管密度为51.5%。平均RNFL厚度100 um。
Figure 3. Glaucoma-related examination results in patients with glaucoma and normal control
图1. 不同时期青光眼患者和正常对照人群青光眼相关检查结果。随青光眼进展,OCTA提示视盘旁及黄斑区血管密度降低
 (a) (b)
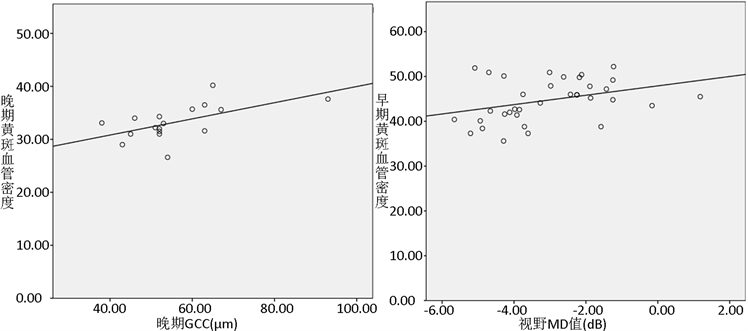 (c) (d) A:早期黄斑区平均毛细血管密度与黄斑区GCC平均厚度值的相关性散点图(r = 0.781, P < 0.05) (n = 35);B:进展期黄斑区平均毛细血管密度与黄斑区GCC平均厚度值的相关性散点图(r = 0.677, P < 0.05) (n = 25);C:晚期黄斑区平均毛细血管密度与黄斑区GCC平均厚度值的相关性散点图(r = 0.582, P < 0.05) (n = 17);D:早期黄斑区平均毛细血管密度与视野MD值的相关性散点图(r = 0.353, P < 0.05) (n = 35)
Figure 2. Sperm plot of the correlation between capillary density in macular area and GCC thickness and field MD value in each stage of glaucoma group
图2. 各期青光眼组黄斑区毛细血管密度与GCC厚度值及视野MD值相关性散点图

Figure 3. ROC curve of optic disc and macular capillary density parameters in the diagnosis of primary open-angle glaucoma
图3. 视盘及黄斑区毛细血管密度参数对原发性开角型青光眼诊断ROC曲线
4. 讨论
青光眼发病率逐年上升,据估计青光眼患病人数将从2013年的6430万增加到2040年的1.118亿 [5] [6] [7] [8]。青光眼的早期诊断尤为重要。传统青光眼诊断的金标准是标准自动视野检查(standard automatic perimetry, SAP),但其早期诊断的敏感性不足,视野的缺损通常在视神经节细胞死亡多于50%时才会出现 [9] [10] [11]。目前仍在寻找能够早期发现并诊断青光眼的临床方式。
由于POAG病因尚不完全明了,可能与遗传有关,高眼压作为主要发病因素已达成共识,其他与发病过程相关的机制有房水正常循环的组织结构破坏及功能障碍、血流动力学改变、遗传学因素等。病变早期常缺乏有效的监测工具,以至于很多患者就诊时已出现不可逆性视神经损伤,错过最佳治疗时机,所以早期诊断尤为重要。OCTA技术的发展为POAG发病机制的血管学说提供了有力的检查手段,可以在视野损害之前监测眼底血流的变化,对于疾病的早期发现具有一定的诊断能力。目前OCTA技术在青光眼患者眼底黄斑区、脉络膜、视乳头周围、RNFL等部位的应用均有相关研究。
光学相干断层扫描血流成像(optical coherence tomography angiography, OCTA)是基于OCT系统的基础上开发出的一种无损技术对视网膜进行成像,与传统的荧光血管造影(FFA)相比,OCTA具有无侵入性,可量化性等优点,通过使用OCT信号的偏振信息和相位信息,通过三维自动图像分割计算法,能够对视网膜分层成像观察视网膜脉络膜血管形态及血流改变情况 [12]。是视网膜影像检查技术发展的里程碑,有助于更好地认识视网膜脉络膜疾病、青光眼和神经眼科疾病的微血管改变。
近年来,有研究利用OCTA技术发现在可疑青光眼患者中,视盘血管密度下降,利用OCTA的视盘血管密度,可以有效鉴别出青光眼,其用于青光眼确诊患者的ROC-AUC为0.84~0.94之间 [13]。在我们的研究中,我们采用了RTVue-XR Avanti频域OCTA设备,由于设备的采集范围不同,其血管密度值并不能直接比较,但结论较为类似,青光眼患者的视盘及黄斑区血管密度都明显下降。这与Lommatzsch等 [14] 及Rao等 [15] 的研究结果相似。
此外,我们还对早、中、晚各期青光眼进行分组研究,分组研究的结果提示,随着青光眼的进展,血管密度逐步下降。Liu等 [16] 发现,与健康人相比,POAG患眼中cpVD明显减小,认为青光眼血管损伤可能在血管水平上首先体现出来,可支持本研究结论。POAG组视盘RPC层各期毛细血管密度均较不同,随着病情进展逐渐减少。RPC位于神经纤维层内,并且其缺乏与神经纤维束的吻合,在青光眼病程中RPC层血管网容易丧失。本研究结果进一步证实了青光眼患者神经节细胞的损害与血流因素有关,而毛细血管的受损是神经节细胞损害的原因还是结果仍需进一步研究。
本研究发现:①与早期青光眼组视盘毛细血管密度(全周及各象限)比较,进展期和晚期青光眼组的视盘毛细血管密度各参数(全周及各象限)均明显降低,差异均有统计学意义(均为P < 0.01)。②随着病情进展,青光眼患者黄斑区毛细血管密度、视盘毛细血管密度明显减少,即黄斑区毛细血管密度、视盘毛细血管可作为青光眼随访过程中检测的指标。③早期青光眼组的黄斑区毛细血管密度与正常对照组比较,差异具有显著统计学意义(为P < 0.01),即黄斑区毛细血管密度在早期青光眼中具有较高的敏感性。但正常对照组的视盘全周及各象限的血管密度与早期青光眼组的差异无明显统计学意义、早期及进展期青光眼组视盘毛细血管密度与视野MD值相关性无明显统计学差异、进展期与晚期青光眼组黄斑区毛细血管密度与视野MD值相关性无明显统计学差异(P > 0.05),可能的原因有:①本研究纳入样本量少,分组后有些组病例数偏少,这可能混杂一些干扰因素引起的误差。②原发性开角型青光眼发病隐匿,且视野等检查在青光眼早期诊断方面存在一定的局限,敏感性偏低。③现有的OCT血管成像系统对于视盘与黄斑区毛细血管密度相关参数测量分析只是单纯量化数据,尚未排除年龄、屈光度差异、屈光介质等混杂因素的干扰。④检查室周围环境有关(周围环境安静程度会影响受试者注意力集中)。⑤受试者大多数年龄偏大,可能与配合程度及疲劳程度有关。
既往有研究发现 [17],POAG患眼视盘毛细血管平均密度与RNFL厚度呈正相关,视盘大血管直径与视野MD呈正相关,他们认为血管与结构和功能均相关,通过OCTA观察视盘血流情况可作为青光眼早期诊断的参考,但该研究未比较血管还是结构更能反映视功能变化。在此同时,我们对血流参数的青光眼诊断价值也做了评估,结果与Yarmohammadi等人 [18] 相似,黄斑区及视盘区的毛细血管密度的ROC-AUC在0.79~0.85之间。具有较高的诊断效能。这提示我们可以通过分层分析毛细血管密度提高对POAG的诊断效能。
总之,OCTA为检测眼底视网膜微循环提供了新的方法。在青光眼患者中,可以通过OCTA发现血管密度的下降。OCTA有望成为青光眼的早期诊断的一种新方法。
基金项目
爱尔眼科医院集团科研基金项目,《观测青光眼眼底血流微循环缺血改变与视网膜神经节细胞及视神经损害的关系》(编号:AF1906D1)。
文章引用
黄丽娜,李 强,黄 鹏,林 晨,张志强,段阗阗,何 芬,曾东汇. 应用光学相干断层扫描血流成像技术分析青光眼的微循环变化
Analysis of Microcirculation Changes in the Macular Area and Optic Disc of Primary Open-Angle Glaucoma Using Optical Coherence Tomograph Angiography[J]. 眼科学, 2021, 10(02): 94-102. https://doi.org/10.12677/HJO.2021.102011
参考文献
- 1. Bourne, R.R., Stevens, G.A., White, R.A., Smith, J.L., Flaxman, S.R., Price, H., et al. (2013) Causes of Vision Loss Worldwide, 1990-2010: A Systematic Analysis. The Lancet Global Health, 1, e339-e349.
https://doi.org/10.1016/S2214-109X(13)70113-X - 2. Quigley, HA. (2005) New Paradigms in the Mechanisms and Management of Glaucoma. Eye, 19, 1241-1248.
https://doi.org/10.1038/sj.eye.6701746 - 3. 樊宁, 黄丽娜, 申晓丽, 成洪波, 刘旭阳. 青光眼患者视网膜结构与功能损害的关系[J]. 中华实验眼科杂志, 2015, 33(3): 250-254.
- 4. 樊宁, 黄丽娜, 何靖, 申晓丽, 曾琨, 成洪波. 频域OCT检测青光眼视网膜神经节细胞复合体厚度的研究[J]. 中华实验眼科杂志, 2012, 30(8): 743-747.
- 5. Quigley, H.A. and Broman, A.T. (2006) The Number of People with Glaucoma Worldwide in 2010 and 2020. British Journal of Ophthalmology, 90, 262-267.
https://doi.org/10.1136/bjo.2005.081224 - 6. Wong, T.Y., Loon, S.C. and Saw, S.M. (2006) The Epidemiology of Age Related Eye Diseases in Asia. British Journal of Ophthalmology, 90, 506-511.
https://doi.org/10.1136/bjo.2005.083733 - 7. Tham, Y.C., Li, X., Wong, T.Y., Quigley, H.A., Aung, T. and Cheng, C.Y. (2014) Global Prevalence of Glaucoma and Projections of Glaucoma Burden through 2040: A Systematic Review and Meta-Analysis. Ophthalmology, 121, 2081- 2090.
https://doi.org/10.1016/j.ophtha.2014.05.013 - 8. Chan, E.W., Li, X., Tham, Y.C., Liao, J. and Cheng, C.Y. (2016) Glaucoma in Asia: Regional Prevalence Variations and Future Projections. British Journal of Ophthalmology, 100, 78-85.
https://doi.org/10.1136/bjophthalmol-2014-306102 - 9. Kerrigan-Baumrind, L.A., Quigley, H.A., Pease, M.E., Kerrigan, D.F. and Mitchell, S. (2000) Number of Ganglion Cells in Glaucoma Eyes Compared with Threshold Visual Field Tests in the Same Persons. Investigative Ophthalmology & Visual Science, 41, 741-748.
- 10. 黄丽娜, 成洪波, 赵军, 樊宁. 两种光学相干断层扫描仪测量视网膜神经纤维层厚度的比较[C]//中华医学会. 第三届全球华人眼科学术大会暨中华医学会第十一届全国眼科学术大会论文汇编, 北京: 中华医学会, 2006: 1.
- 11. 黄丽娜, 樊宁, 成洪波, 赖铭莹, 赵军. 两种相干光断层扫描仪测量兔眼视网膜厚度和组织学检查的对比研究[J]. 眼科, 2009, 18(4): 239-242.
- 12. de Carlo, T.E., Romano, A., Waheed, N.K. and Dukerl, J.S. (2015) A Review of Optical Coherence Tomography Angiography (OCTA). International Journal of Retina and Vitreous, 1, Article No. 5.
https://doi.org/10.1186/s40942-015-0005-8 - 13. Adeleh, Y., Zangwill, L.M., Alberto, D.F., Hee, S.M., Isabel, M.P., Naeem, F., et al. (2016) Optical Coherence Tomography Angiography Vessel Density in Healthy, Glaucoma Suspect, and Glaucoma Eyes. Investigative Ophthalmology & Visual Science, 57, OCT451-OCT459.
https://doi.org/10.1167/iovs.15-18944 - 14. Lommatzsch, C., Rothaus, K., Koch, J.M., Heinz, C. and Grisanti, S. (2018) Vessel Density in OCT Angiography Permits Differentiation between Normal and Glaucomatous Optic Nerve Heads. International Journal of Ophthalmology, 11, 835- 843. http://doi.org/10.18240/ijo.2018.05.20
- 15. Rao, H.L., Pradhan, Z.S., Weinreb, R.N., Reddy, H.B., Riyazuddin, M., Dasari, S., et al. (2016) Regional Comparisons of Optical Coherence Tomography Angiography Vessel Density in Primary Open-Angle Glaucoma. American Journal of Ophthalmology, 171, 75-83.
https://doi.org/10.1016/j.ajo.2016.08.030 - 16. Liu, L., Jia, Y., Takusagawa, H.L., Pechauer, A.D., Edmunds, B., Lombardi, L., et al. (2015) Optical Coherence Tomography Angiography of the Peripapillary Retina in Glaucoma. JAMA Ophthalmology, 133, 1045-1052.
https://doi.org/10.1001/jamaophthalmol.2015.2225 - 17. Zhong, Y. and Che, H.X. (2018) Detective Values of Optical Coherence Tomography Angiography for Primary Glaucoma. Recent Advances in Ophthalmology, 38, 352-356.
- 18. Yarmohammadi, A., Zangwill, L.M., Manalastas, P.I.C., Fuller, N.J., Diniz-Filho, A., Saunders, L.J., et al. (2018) Peripapillary and Macular Vessel Density in Patients with Primary Open-Angle Glaucoma and Unilateral Visual Field Loss. Ophthalmology, 125, 578-587.
https://doi.org/10.1016/j.ophtha.2017.10.029