 Hans Journal of Chemical Engineering and Technology 化学工程与技术, 2013, 3, 156-160 http://dx.doi.org/10.12677/hjcet.2013.35028 Published Online September 2013 (http://www.hanspub.org/journal/hjcet.html) Using Tablecurve 3D to Predict the Migration of Acrylonitrile in 3% Acetic Acid Simulants Tingfei Liu*, Chunyan Sun, Danfeng Ye Taizhou Entry-Exit Inspection and Quarantine Bureau, Taizhou Email: *ltf@tz.ziq.gov.cn Received: Jun. 14th, 2013; revised: Jul. 10th, 2013; accepted: Jul. 18th, 2013 Copyright © 2013 Tingfei Liu et al. This is an open access article distributed under the Creative Commons Attribution License, which permits unre- stricted use, distribution, and reproduction in any medium, provided the original work is properly cited. Abstract: The migration regularity of acrylonitrile in fo od simulant [3% (w/v) acetic acid] at different soak temperature and soak time was systematically studied by a GC-HS method. The three-dimensional surface fitting mode from table- curve 3D software was adopted to form the fitted curve or the migration model by fitting the migration data. And the sui- ta bility of the mode l has also been validated b y other 15 different samples. The experimental results indicate that, for all co- polymerization of acrylonitrile plastic products, when the migr ation of acrylon itrile in one migration cond ition is known, the migration of acrylonitrile in other migration conditions can be calculated by using the model, which compared with the measured values are within 10% relative standard deviation. It shows t hat this model is reliable and widely applicable. Keywords: Acrylonitrile; Plastic Products; Three-Dimensional Surface; Migration Model; GC-HS 利用 Tablecurve 3D预测 3%乙酸模拟物中丙烯腈迁移量值 刘艇飞*,孙春燕,叶丹凤 台州出入境检验检疫局,台州 Email: *ltf@tz.ziq.gov.cn 收稿日期:2013 年6月14 日;修回日期:2013 年7月10 日;录用日期:2013 年7月18 日 摘 要:采用顶空气相色谱法,系统研究了丙烯腈共聚塑料制品在 3%乙酸水溶液(w/v,下同)中不同浸泡温度、 不同浸泡时间条件下丙烯腈的迁移规律。采用 Tablecurve3D 软件对迁移数据进行三维曲面拟合,得到拟合曲面 方程即迁移模型,然后用另外 15 种不同的样品验证该模型的适宜性。实验结果表明,对于丙烯腈共聚塑料制品, 在已知某一浸泡条件下的丙烯腈迁移量值,即可根据该拟合曲面方程,计算出其他浸泡条件下的丙烯腈迁移量 值。该值与实测均值的相对差值在 10%以内,说明该拟合方程是可靠的、广泛适用的。 关键词:丙烯腈;塑料制品;三维曲面;迁移模型;顶空气相色谱 1. 引言 (EU) NO 10/2011法规[1]对与食品接触的塑料制 品中 800 多种物质的特定迁移量或特定总迁移量加以 了限定。因此出口到欧盟的与食品接触塑料制品必须 要进行这些物质特定迁移量的检测,并符合限量法规 要求后才能顺利出口。而特定迁移量的检测要用合适 的模拟物用于模拟该制品拟接触的食品种类,选用合 适的浸泡温度和浸泡时间进行迁移试验,然后再检测 迁移试验后模拟物中目标物的特定迁移量。当前,(EU) NO 10/2011法规提出了几种可用于特定迁移量筛检 的方案,一种是通过检测塑料制品中的总迁移量;另 *通讯作者。 Copyright © 2013 Hanspub 156  利用 Tablecurve 3D预测 3%乙酸模拟物中丙烯腈迁移量值 一种是采用迁移效率更高的模拟物替代法规要求的 常规模拟物;还有一种就是通过数学建模,建立计算 结果高出实际迁移量的扩散模型来筛检相关物质的 特定迁移量。前两种筛检方法并不能有效地解决浸泡 条件复杂多变问题,而第三种筛检方法能通过研究得 到的迁移模型,计算出不同浸泡温度和浸泡时间下的 特定迁移量值,从而能有效地解决浸泡条件复杂多变 的问题。 本研究主要针对丙烯腈共聚塑料制品(如丙烯腈 –丁二烯–苯乙烯 ABS、丙烯腈–苯乙烯AS 制品), 其中作为组分之一的丙烯腈因聚合不完全而残留在 制品中,在与食品接触的过程中会迁移进入食品,从 而影响人体健康。(EU) NO 10/2011 法规规定其特定 迁移量为不得检出,检出限为0.01 mg/kg。丙烯腈具 有挥发性,因此并不适合采用总迁移量筛检的方法; 而且丙烯腈的检测是采用顶空气相色谱法,没有净化 过程,很多提取效率较高的有机溶剂中会存在较大的 干扰峰,因此也不适合第二种替代模拟物的筛检。因 此本研究选择欧盟法规中规定的用来模拟酸性食品 的3%乙酸水溶液(W /V)作为食品模拟物,来系统研究 在该模拟物中丙烯腈在不同浸泡温度和不停浸泡时 间条件下的迁移规律,并通过Tablecurve 3D数据分析 软件进行迁移建模,并将建立的模型,成功应用于3% 乙酸模拟物中丙烯腈迁移量的筛检。 2. 试验部分 2.1. 仪器与试剂 CP-3800 气相色谱仪,配备 TSD氮磷检测器和 Combipal 顶空二合一自动进样器(美国Bruker 公司); FD 115烘箱(德国 Binder 公司);丙烯腈标准品(99.0%, 德国 DR 公司);丙腈标准品(99.5%,德国 DR 公司); 1,2-丙二醇碳酸酯为色谱纯;精制橄榄油、无水乙醇、 冰乙酸均为分析纯;实验室用水为超纯水。 2.2. 丙烯腈迁移规律的研究 丙烯腈共聚制品参照 BS EN 13130-1:2004或者 SN/T 2280-2009标准[2,3]中的实验条件浸泡后,参照 BS EN 13130-3:2004或者SN/T 2197-2008标准[4,5]用 顶空气相色谱仪对迁移到食品模拟物中的丙烯腈进 行分析。 本研究选择 3%乙酸模拟物用于模拟酸性食品, 分别选择浸泡温度为室温,20℃,40℃~100 ℃,每间 隔5℃,浸泡时间分别为 1 h和2 h。选择浸泡时间为 1 h~2 4 h,每间隔1 h,浸泡温度分别为40℃和 70℃。 按照 3%乙酸模拟物填充到塑料制品距边缘约 5 mm 处的填充法进行浸泡。然后使用配有氮磷检测器的顶 空气相色谱测定各浸泡后模拟物中的丙烯腈含量,用 于迁移规律的分析。 3. 结果与讨论 3.1. 不同浸泡条件下的丙烯腈迁移量值 按照丙烯腈迁移规律研究方案,分别对同一塑料 制品进行不同浸泡条件下的丙烯腈迁移量进行检测, 结果如表1: 从上表可以看出,同一制品中丙烯腈迁移量随着 浸泡温度的升高和浸泡时间的增加而增加,这也给后 续迁移建模提供了必要条件。 3.2. 利用 Tablecurve 3D软件进行迁移建模 将上表所得的迁移量数据输入到 Tablecurve 3D 软件[6]中,选择三维曲面拟合,得到拟合后的三维曲 面图(见图 1)。 3.3. 三维曲面拟合方程 根据图 1从Tablecurve 3D软件中得出拟合方程如 下: 2 2 33 22 ƒ7.1060585003 3.4014686004 1.4376816 0035.9472705 006 7.4832674 0057.7689293 005 1.221373 0089.7145385 007 5.46700370071.308372 006 i Z EE EYE X EY EXY EX EY EXY EXY X 其中 Z为丙烯腈迁移量(mg/kg), ƒ i为拟合方程影响因 子,X为浸泡温度(℃),Y为浸泡时间(h)。 3.4. 拟合方程的验证 为验证拟合方程的适用性,即是否能满足其他塑 料制品的要求,本研究选取了另外15种丙烯腈共聚 制品,分别检测两种浸泡条件下的丙烯腈迁移量。利 用其中一种浸泡条件和对应的丙烯腈迁移量值计算 出该样品的 ƒ i值,然后再通过拟合方程计算出另一种 Copyright © 2013 Hanspub 157 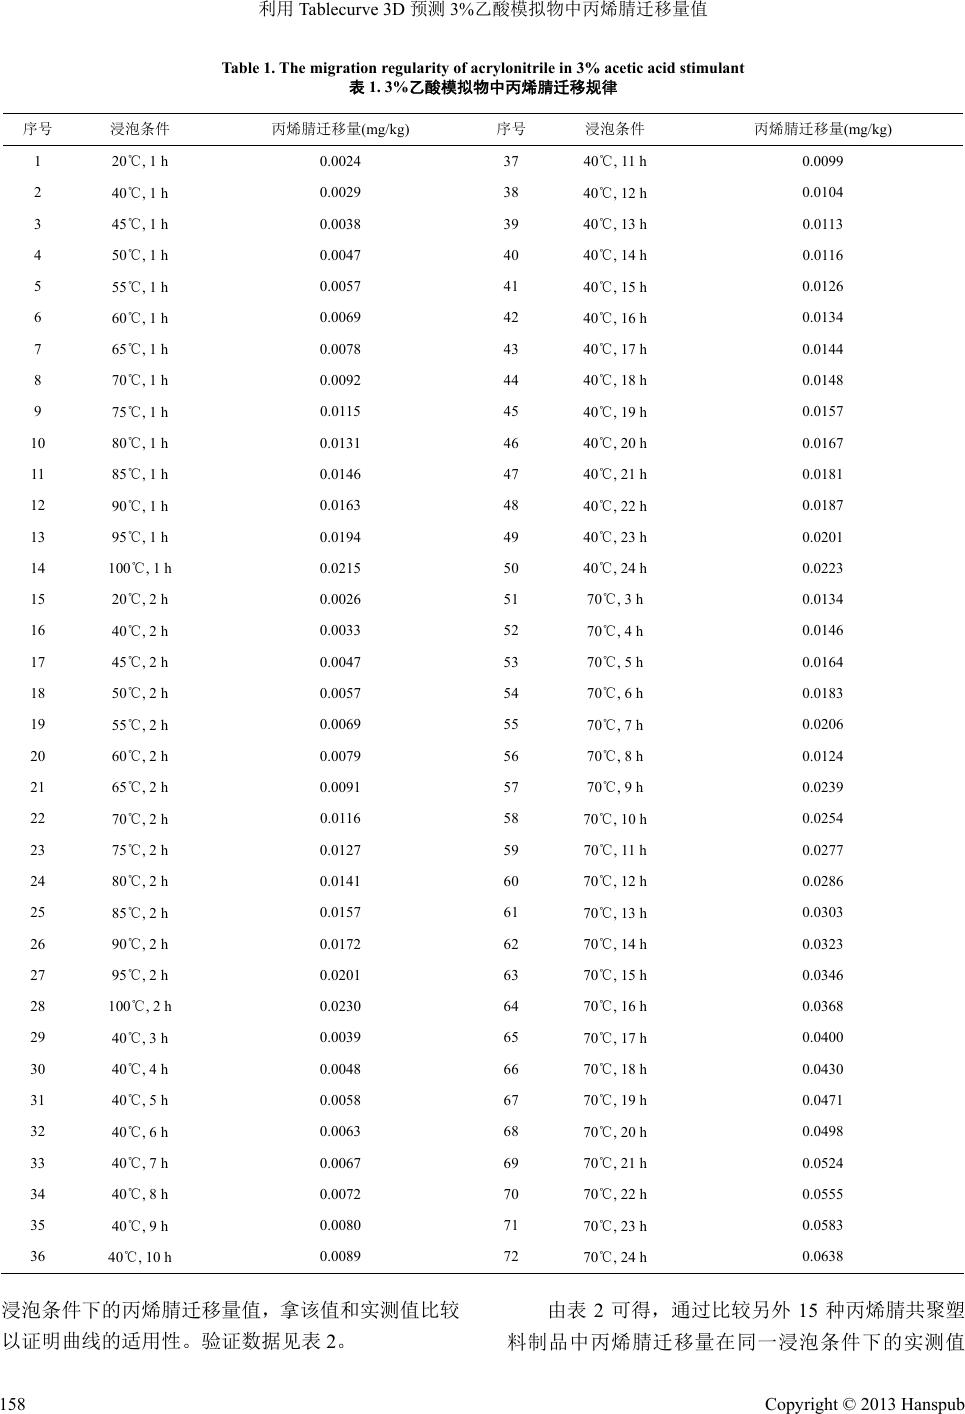 利用 Tablecurve 3D预测 3%乙酸模拟物中丙烯腈迁移量值 Copyright © 2013 Hanspub 158 Table 1. The migration regularity of acrylonitrile in 3% acetic acid stimulant 表1. 3%乙酸模拟物中丙烯腈迁移规律 序号 浸泡条件 丙烯腈迁移量(mg/kg) 序号 浸泡条件 丙烯腈迁移量(mg/kg) 1 20℃, 1 h 0.0024 37 40℃, 1 1 h 0.0099 2 40℃, 1 h 0.0029 38 40℃, 12 h 0.0104 3 45℃, 1 h 0.0038 39 40℃, 13 h 0.0113 4 50℃, 1 h 0.0047 40 40℃, 14 h 0.0116 5 55℃, 1 h 0.0057 41 40℃, 15 h 0.0126 6 60℃, 1 h 0.0069 42 40℃, 16 h 0.0134 7 65℃, 1 h 0.0078 43 40℃, 17 h 0.0144 8 70℃, 1 h 0.0092 44 40℃, 18 h 0.0148 9 75℃, 1 h 0.0115 45 40℃, 19 h 0.0157 10 80℃, 1 h 0.0131 46 40℃, 20 h 0.0167 11 85℃, 1 h 0.0146 47 40℃, 21 h 0.0181 12 90℃, 1 h 0.0163 48 40℃, 22 h 0.0187 13 95℃, 1 h 0.0194 49 40℃, 23 h 0.0201 14 100℃, 1 h 0.0215 50 40℃, 24 h 0.0223 15 20℃, 2 h 0.0026 51 70℃, 3 h 0.0134 16 40℃, 2 h 0.0033 52 70℃, 4 h 0.0146 17 45℃, 2 h 0.0047 53 70℃, 5 h 0.0164 18 50℃, 2 h 0.0057 54 70℃, 6 h 0.0183 19 55℃, 2 h 0.0069 55 70℃, 7 h 0.0206 20 60℃, 2 h 0.0079 56 70℃, 8 h 0.0124 21 65℃, 2 h 0.0091 57 70℃, 9 h 0.0239 22 70℃, 2 h 0.0116 58 70℃, 10 h 0.0254 23 75℃, 2 h 0.0127 59 70℃, 1 1 h 0.0277 24 80℃, 2 h 0.0141 60 70℃, 12 h 0.0286 25 85℃, 2 h 0.0157 61 70℃, 13 h 0.0303 26 90℃, 2 h 0.0172 62 70℃, 14 h 0.0323 27 95℃, 2 h 0.0201 63 70℃, 15 h 0.0346 28 100℃, 2 h 0.0230 64 70℃, 16 h 0.0368 29 40℃, 3 h 0.0039 65 70℃, 17 h 0.0400 30 40℃, 4 h 0.0048 66 70℃, 18 h 0.0430 31 40℃, 5 h 0.0058 67 70℃, 19 h 0.0471 32 40℃, 6 h 0.0063 68 70℃, 20 h 0.0498 33 40℃, 7 h 0.0067 69 70℃, 21 h 0.0524 34 40℃, 8 h 0.0072 70 70℃, 22 h 0.0555 35 40℃, 9 h 0.0080 71 70℃, 23 h 0.0583 36 40℃, 10 h 0.0089 72 70℃, 24 h 0.0638 浸泡条件下的丙烯腈迁移量值,拿该值和实测值比较 以证明曲线的适用性。验证数据见表 2。 由表 2可得,通过比较另外15 种丙烯腈共聚塑 制品中丙烯腈迁移量在同一浸泡条件下的实测值 料 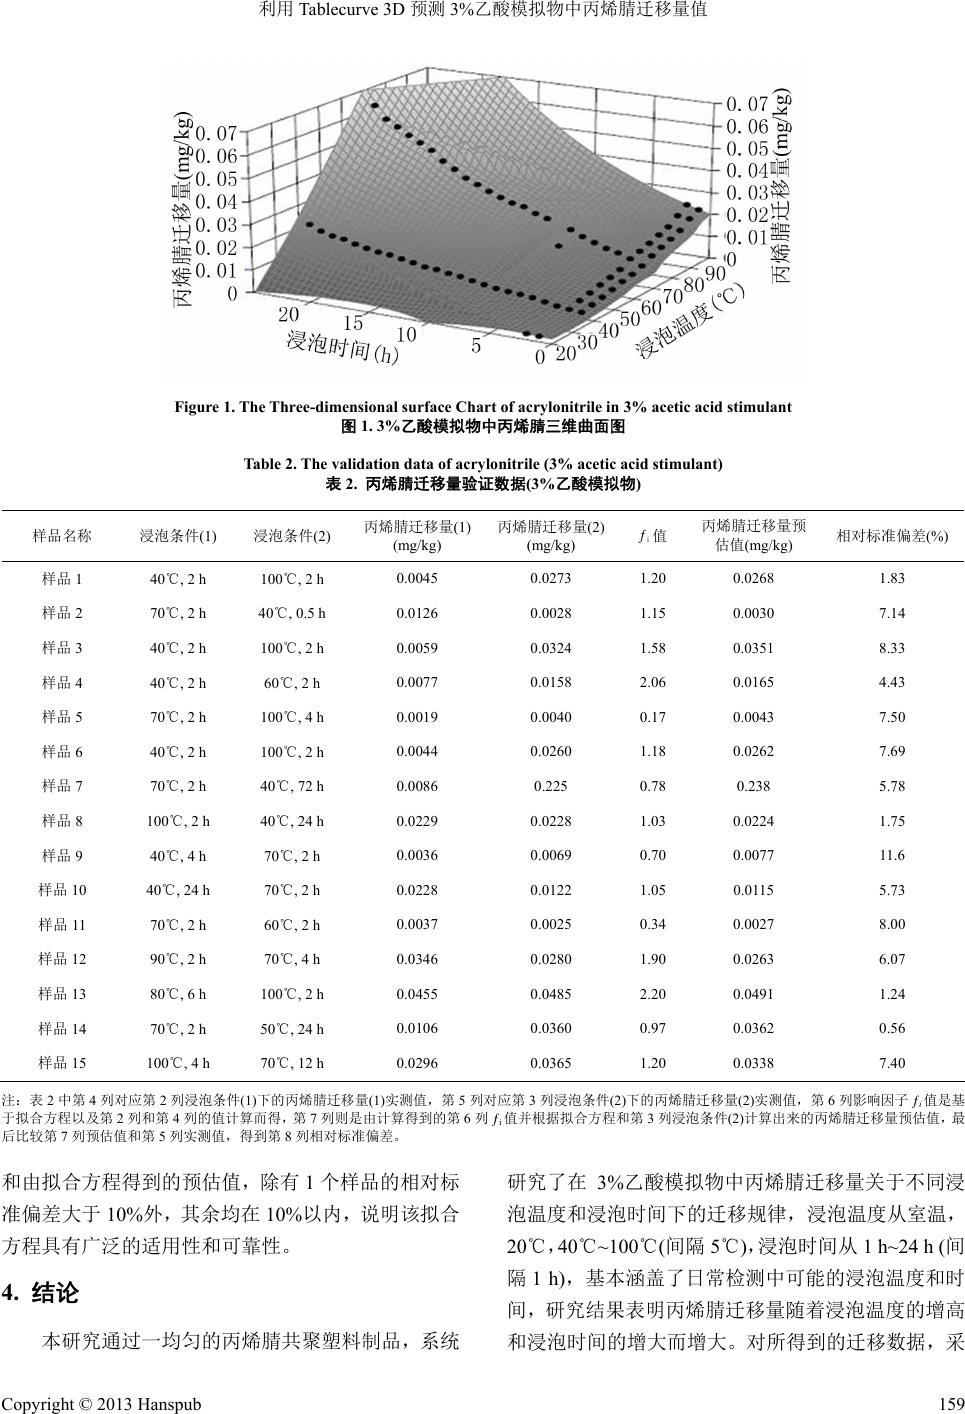 利用 Tablecurve 3D预测 3%乙酸模拟物中丙烯腈迁移量值 Figure 1. The Three-dimensional surface Chart of acrylonitrile in 3% acetic acid stimulant 图1. 3%乙酸模拟物中丙烯腈三维曲面图 Table 2. The validation data of acrylonitrile (3% acetic acid stimulant) 表2. 丙烯腈迁移量验证数据(3%乙酸模拟物) 样品名称 浸泡条件(1) 浸泡条件(2) 丙烯腈迁移量(1) (mg/kg) 丙烯腈迁移量(2) (mg/kg) ƒi值 丙烯腈迁移量预 估值(mg/kg) 相对标准偏差(%) 样品 1 40℃, 2 h 100℃, 2 h 0.0045 0.0273 1.20 0.0268 1.83 样品 2 70℃, 2 h 40℃, 0.5 h 0.0126 0.0028 1.15 0.0030 7.14 样品 3 40℃, 2 h 100℃, 2 h 0.0059 0.0324 1.58 0.0351 8.33 样品 4 40℃, 2 h 60℃, 2 h 0.0077 0.0158 2.06 0.0165 4.43 样品 5 70℃, 2 h 100℃, 4 h 0.0019 0.0040 0.17 0.0043 7.50 样品 6 40℃, 2 h 100℃, 2 h 0.0044 0.0260 1.18 0.0262 7.69 样品 7 70℃, 2 h 40℃, 72 h 0.0086 0.225 0.78 0.238 5.78 样品 8 100℃, 2 h 40℃, 24 h 0.0229 0.0228 1.03 0.0224 1.75 样品 9 40℃, 4 h 70℃, 2 h 0.0036 0.0069 0.70 0.0077 11.6 样品 10 40℃, 24 h 70℃, 2 h 0.0228 0.0122 1.05 0.0115 5.73 样品 11 70℃, 2 h 60℃, 2 h 0.0037 0.0025 0.34 0.0027 8.00 样品 12 90℃, 2 h 70℃, 4 h 0.0346 0.0280 1.90 0.0263 6.07 样品 13 80℃, 6 h 100℃, 2 h 0.0455 0.0485 2.20 0.0491 1.24 样品 14 70℃, 2 h 50℃, 24 h 0.0106 0.0360 0.97 0.0362 0.56 样品 15 100℃, 4 h 70℃, 12 h 0.0296 0.0365 1.20 0.0338 7.40 注:表 2中第 4列对应第 2列浸泡条件(1)下的丙烯腈迁移量(1)实测值,第5列对应第 3列浸泡条件(2)下的丙烯腈迁移量(2)实测值,第6列影响因子 ƒi值是基 于拟合方程以及第 2列和第 4列的值计算而得,第 7列则是由计算得到的第 6列ƒi值并根据拟合方程和第3列浸泡条件(2)计算出来的丙烯腈迁移量预估值,最 后比较第 7列预估值和第5列实测值,得到第8列相对标准偏差。 和由拟合方程得到的预估值,除有 1个样品的相对标 准偏差大于 10%外,其余均在 10%以内,说明该拟合 方程具有广泛的适用性和可靠性。 4. 结论 本研究通过一均匀的丙烯腈共聚塑料制品,系统 研究了在 3%乙酸模拟物中丙烯腈迁移量关于不同浸 泡温度和浸泡时间下的迁移规律,浸泡温度从室温, 20℃,40℃~100℃(间隔 5℃),浸泡时间从 1 h~2 4 h (间 隔1 h),基本涵盖了日常检测中可能的浸泡温度和时 间,研究结果表明丙烯腈迁移量随着浸泡温度的增高 和浸泡时间的增大而增大。对所得到的迁移数据,采 Copyright © 2013 Hanspub 159  利用 Tablecurve 3D预测 3%乙酸模拟物中丙烯腈迁移量值 用Tablecurve 3D软件进行三维曲面的拟合,得到拟合 曲面方程,作为丙烯腈在 3%乙酸模拟物中的迁移模 型。通过另外 15 种不同丙烯腈共聚塑料制品分别在 两种不同浸泡条件下的丙烯腈迁移量值,结合拟合曲 面方程,比较由方程得到的预估值和实测值之间的相 对标准偏差,基本上都在 10%以内,能满足丙烯腈迁 移量检测要求,可用于日常检测中丙烯腈的预估和筛 检,从而能够大大地缩短检测周期,提高工作效率。 参考文献 (References) [1] EU. On plastic materials and articles intended to come into contact with food (Text with EEA relevance) [S]. (EU)10/2011. [2] BSI. Materials and articles in contact with foodstuffs—Plastics substances subject to limitation—Part 1: Guide to test methods for the specific migration of substances from plastics to foods and food simulants and the determination of substances in plas- tics and the selection of conditions of exposure to food simulants. [S]. BS EN 13130-1, 2004. [3] 周宇艳, 杨勇等. SN/T 2280-2009 食品接触材料——塑料中 受限物质塑料中物质向食品及食品模拟物特定迁移试验方法 和含量测定以及食品模拟物暴露条件选择的指南准[S]. 北京: 中国标准出版社, 2009. [4] BSI. Materials and articles in contact with foodstuffs—Plastics substances subject to limitation—Part 3: Determination of acry- lonitrile in food and food simulants. BS EN 13130-3, 2004. [5] 林振兴, 邬蓓蕾等. SN/T 2197-2008 食品接触材料——高分 子材料食品和食品模拟物中丙烯腈的测定气相色谱法[S]. 北 京: 中国标准出版社, 2008. [6] 钟守炎, Y. S. Yang and C. Gao. 用Tablecurve 3D软件预测连 续油管的直径增长[J]. 石油机械, 1999, 27(10): 22-23. Copyright © 2013 Hanspub 160 |