Journal of Sensor Technology and Application
Vol.
11
No.
04
(
2023
), Article ID:
68606
,
10
pages
10.12677/JSTA.2023.114038
铁观音茶叶激光诱导等离子体特性研究
李静文
天津理工大学理学院,天津
收稿日期:2023年5月11日;录用日期:2023年7月5日;发布日期:2023年7月13日

摘要
中国是茶的故乡和发源地,如今茶文化已经传播到世界各地,茶叶是仅次于水的第二大饮料。本文应用激光诱导击穿光谱(LIBS)技术对铁观音茶叶的元素组成进行了研究,发现铁观音茶叶含有Ca、Na、Mg、K、Fe、Cu、Zn、Mn、Sr、Al、Li和Ba等元素,同时还探测到了CN和C2分子的谱线。其次,对激光诱导下铁观音茶叶产生的等离子体特性进行了研究,通过对Hα谱线进行洛伦兹拟合获得电子数密度(Ne)为1.44 × 1017 cm−3,建立Saha-Boltzmann图,计算得等离子体温度(T)为8161 K。最后,使用LIFBASE软件对CN ( )分子进行模拟,获得振动温度(Tv)和转动温度(Tr)分别为6800 K和5800 K,且这三个温度在实验中满足关系T > Tv > Tr,这个关系与等离子体随时间演化的实际情况相符。
关键词
激光诱导击穿光谱,茶叶,CN自由基,等离子体温度,电子数密度

Study on the Characteristics of Laser-Induced Plasma in Tieguanyin Tea
Jingwen Li
School of Science, Tianjin University of Technology, Tianjin
Received: May 11th, 2023; accepted: Jul. 5th, 2023; published: Jul. 13th, 2023

ABSTRACT
China is the hometown and birthplace of tea. Nowadays, tea culture has spread to all over the world and tea is the second largest beverage after water. In this study, the elemental composition of Tieguanyin tea was studied by laser-induced breakdown spectroscopy (LIBS). Ca, Na, Mg, K, Fe, Cu, Zn, Mn, Sr, Al, Li and Ba were found in Tieguanyin tea. The spectral lines of CN and C2 were also detected. Then, the plasma characteristics of Tieguanyin tea of laser-induction were researched. The electron density (Ne) was 1.44 × 1017 cm−3 by using the Lorentz fitting of the Hα line. The Saha-Boltzmann plot was established, and the plasma temperature (T) was calculated to be 8161 K. Finally, LIFBASE software was used to simulate CN ( ) molecule, and the vibration temperature (Tv) and rotation temperature (Tr) were obtained as 6800 K and 5800 K, respectively. In the experiment, the three temperatures met the relationship T > Tv > Tr, which was consistent with the actual situation of plasma evolution over time.
Keywords:Laser-Induced Breakdown Spectroscopy, Tea, CN Free Radical, Plasma Temperature, Electron Density

Copyright © 2023 by author(s) and Hans Publishers Inc.
This work is licensed under the Creative Commons Attribution International License (CC BY 4.0).
http://creativecommons.org/licenses/by/4.0/


1. 引言
茶叶主要由蛋白质、氨基酸、咖啡因、茶多酚、碳水化合物、维生素等有机化合物和金属氧化物、磷酸盐、硫酸盐、氯化物和硅酸盐等无机化合物组成 [1] 。铁观音茶因其宜人的香气和高含量的氨基酸、维生素、矿物质、茶多酚和生物碱而被认为是一种健康、安全的饮料 [2] 。作为中国最受欢迎的乌龙茶之一,铁观音是一种半发酵茶,主要产自福建南部 [3] 。迄今为止,已有多种成熟且应用广泛的元素分析方法应用于茶叶的检测,如电感耦合等离子体原子发射光谱法(ICP-AES) [4] 、电感耦合等离子体质谱法(ICP-MS) [5] 、共聚焦拉曼光谱法 [6] 、傅里叶变换红外(FT-IR)光谱法 [7] 、离子色谱和分光光度法 [8] 、X射线荧光(XRF) [9] 和X射线衍射(XRD) [10] 等。ICP-AES和ICP-MS法的分析精度高,适用范围广,但是仪器成本高,不能大规模推广,通常样品需要进行酸溶或碱溶等处理。FT-IR方法是依据分子振动能级的变化来检测分子中的官能团,不能对原子进行分析。XRF和XRD方法分析效率高,通常用于物理形态样品的分析,但是由于其发射光源为X射线,对人体具有一定的危害性,同时对质量较小原子的测量并不灵敏 [11] 。以上这些方法的样品制备过程耗时且复杂。一旦化学试剂处理不当,不仅会危害人体健康,而且会导致实验结果出错。
与这些技术相比,激光诱导击穿光谱(LIBS)技术在无需或者极少的样品预处理、微损、实时原位测量和多元素同时快速检测等方面具有明显优势,已广泛应用于环境检测 [12] 、土壤重金属检测 [13] 、食品检测 [14] 和生物医学 [15] 等领域。LIBS是一种基于原子发射光谱的元素分析技术,它利用聚焦的高能脉冲激光(激光辐照度大于等于109 W/cm2 [16] )与样品相互作用,烧蚀区域的温度在ps量级升高至104 K [17] ,产生了激光诱导等离子体。在等离子体演化前期,由于电子减速产生的韧致辐射和电子与离子复合的准连续辐射。在短暂的弛豫后(几百ns),等离子体温度冷却,这时处于激发态的原子和离子会从高能级跃迁到低能级,从而产生相应的特征发射谱线 [18] ,可根据这些原子线和离子线识别未知样品的元素组成。在等离子体演化的后期,温度约低于6500 K时,部分离子或原子重组形成分子自由基,产生可见的分子光谱,提供了更多的样品元素信息 [19] 。
本文通过激光诱导击穿光谱实验获得了铁观音茶叶的LIBS光谱,利用其包含的谱线信息对铁观音茶叶中含有的元素进行分析,包括CN自由基分子光谱。其次,对其等离子体特性进行了研究,主要是等离子体温度(T)和电子数密度(Ne),并将LIFBASE拟合出来的振动温度(Tv)和转动温度(Tr)与等离子体温度进行比较。
2. LIBS实验装置
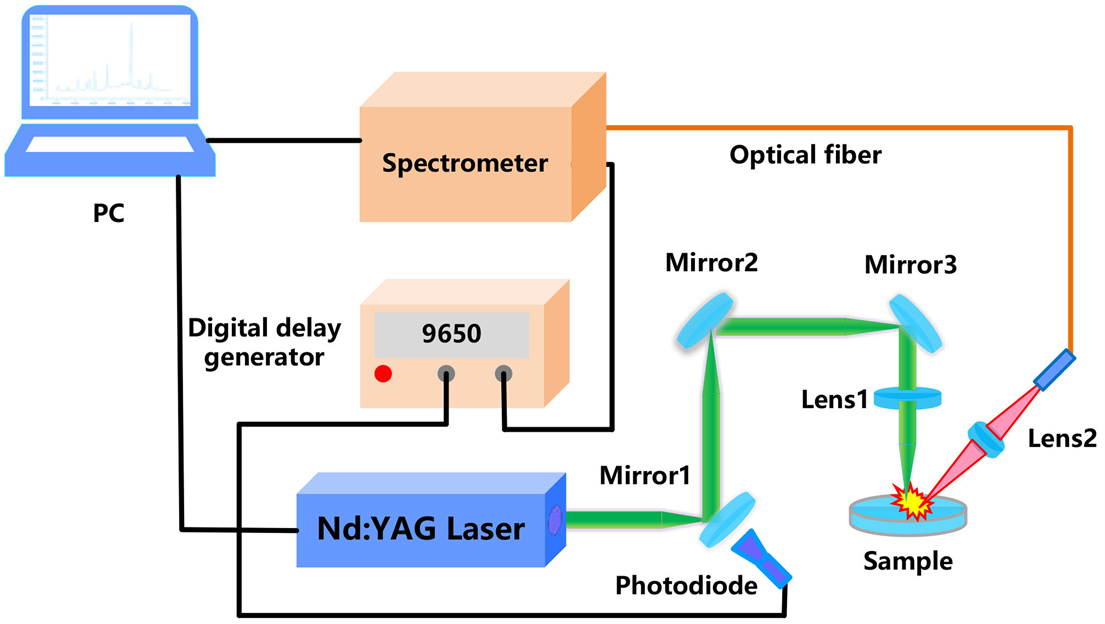
实验装置如图1所示,使用电脑触发一台自制的调Q固体Nd:YAG激光器(波长为1064 nm,脉宽为18 ns,重复频率为1 Hz,单脉冲能量约为285 mJ),光电二极管探测到激光信号的同时输出一个信号至9650延迟发生器,从而利用延迟发生器精确调控延迟时间并输出TTL信号触发四通道CCD光谱仪(AvaSpec-2048-USB2*),四个通道的波长范围分别为300~445 nm、445~570 nm、570~780 nm和780~950 nm,分辨率分别为0.12 nm、0.1 nm、0.15 nm和0.15 nm。然后,激光器发出的烧蚀激光经三个反射镜(反射波长:1064 nm,反射率:99.99%)和一个平凸透镜(直径为25.4 mm,焦距f1 = 150 mm)聚焦后垂直入射于样品表面,与微量样品发生作用从而产生激光诱导等离子体。最后,等离子体荧光被焦距f2 = 60 mm的平凸透镜收集,耦合至光纤后传输到光谱仪。为了避开连续辐射和韧致辐射,光谱仪的延迟时间和积分时间分别设置为1.33 μs和1.05 ms。另外,使用电控二维样品台,保证脉冲激光每次作用于样品的不同位置。

Figure 1. Schematic diagram of LIBS device
图1. LIBS装置图
3. 结果与讨论
3.1. 铁观音茶叶的LIBS光谱图
本实验采用福建省泉州市安溪县长湘怡品牌的铁观音茶叶制备了茶叶样品。在使用粉碎机将茶叶磨成粉末后,称取1 g使用压强为10 MPa的压片机持续工作60 s压成半径为10 mm的茶饼。为了避免烧蚀坑、激光能量波动的影响,每个样品进行200次采样获得平均光谱,从而获得良好的信噪比。
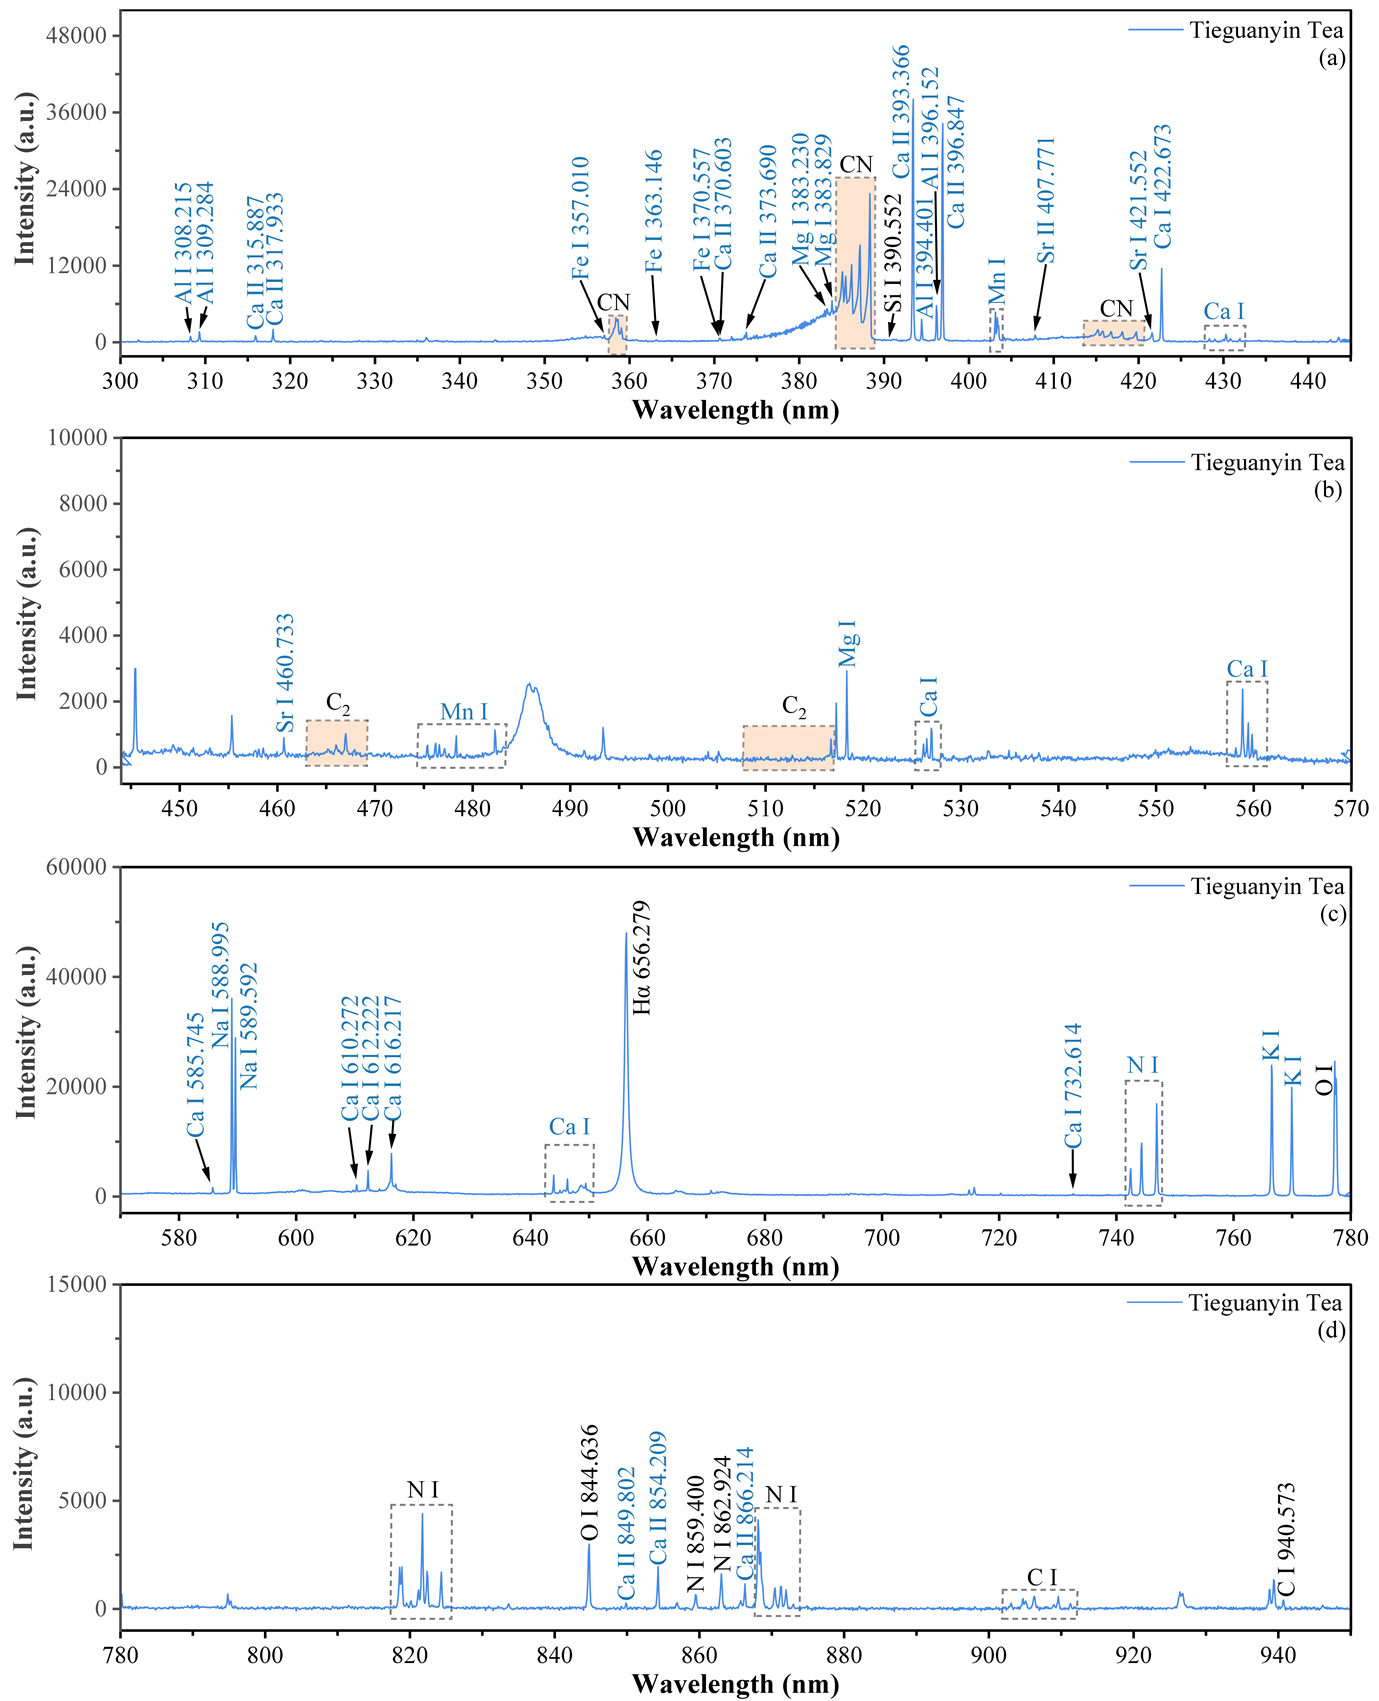
铁观音茶叶的LIBS光谱图如图2所示,波长范围为300~950 nm。参考NIST数据库 [20] ,识别出了茶叶中含有的人体必需营养元素Ca、Na、Mg和K,微量元素Fe、Cu、Zn、Mn和Sr,以及其他金属元素Al、Li和Ba [21] [22] [23] 。同时探测到了C、N、O和H的原子发射谱线,这些谱线一部分是由空气中的空气中N2、O2、CO2、H2O和H2贡献,另一部分则源自于茶叶自身含有的物质。因为茶叶中含有茶氨酸、氨基酸、生物碱以及糖类等大量的有机物,这些有机物的主要成分为C、N、O和H,因此茶叶样品中这些元素的谱线较强。

Figure 2. LIBS spectra of Tieguanyin tea
图2. 铁观音茶叶的LIBS光谱图
另外,在茶叶的LIBS光谱中可以观察到CN和C2自由基的分子带。CN自由基是由样品中的C原子与周围空气中的N原子结合形成 [24] [25] [26] [27] [28] ,而C2来源于有机化合物中存在的芳香环直接裂解的C2Hx碎片 [7] [24] [29] 。茶叶光谱中可以清楚地看到CN分子中由 跃迁产生的电子振转光谱。三种振动跃迁 对应的光谱峰分别位于357~360、381~389和414~422 nm范围,图中每个振动跃迁对应的波长与文献一致 [30] 。
3.2. 等离子体特性的研究
激光与样品作用后产生的等离子体如满足以下3条假设:
1) 等离子体中各元素含量与样品中各元素含量相同;
2) 局域热力学平衡;
3) 光学薄(主要电离过程来自于热电子的碰撞激发过程)。
不考虑自吸收效应 [31] [32] 时,谱线的积分强度 (photon cm−3·s−1)与元素上能级 (eV)和下能级 (eV)的关系可表示为:
(1)
其中 (nm)表示跃迁波长, 为该元素能级 的数密度(cm−3), 为该元素的数密度(cm−3), 为跃迁强度(s−1), 为上能级简并度(无量纲),k为玻尔兹曼常数(eV·K−1),T为等离子体温度(K), 为在等离子体温度T下的元素配分函数(无量纲)。
实际测量并经过不同波长收光效率校正的谱线积分强度 为:
(2)
其中 为样品中的元素含量(无量纲),F (cm3 counts·photon−1 s)为经过不同波长收光效率校正后得到的与波长无关的系统收光效率, (cm−3)为等离子体总的粒子数密度。进行如下变量代换:
(3)
则可以得到:
(4)
其中斜率m反映了等离子体温度,截距 与元素含量的对数成正比。可以得到,某元素的含量为:
(5)
将所有的粒子考虑在内,可以由归一化系数求出 :
(6)
即:
(7)
则某元素的含量:
(8)
两种元素a和b的含量比:
(9)
如果同时存在原子线和离子线时,根据Saha-Boltzmann方程,离子数密度 和原子数密度 的比值为:
(10)
其中 为电子密度(cm−3), (eV)为元素的电离能, 为电子的质量(g),h为普朗克常量(eV s), 和 分别为原子和离子的配分函数。因此,离子线强度:
(11)
取离子线强度的对数(将测量强度经透射率校正),得到:
(12)
因此,Saha-Boltzmann图的 和 分别为:
(13)
(14)
需要注意的是,元素的电离能 会受到等离子体的修正, ,其中 为没有受到等离子体干扰的电离能,电离能修正:
(15)
(F m−1)为真空中介电常数, (nm)为德拜半径。德拜半径
(16)
忽略 ,得
(17)
一般在空气中的LIBS光谱都存在H的谱线。由于巴耳末线的特征以及H的低丰度保证了自吸收效应比较小,并且H的谱线的Stark展宽比重元素的要高一个量级,因此测量误差明显降低。计算电子密度的方法是使用半面积全宽度的方法 [33] :
(19)
其中 表示半面积全宽度。
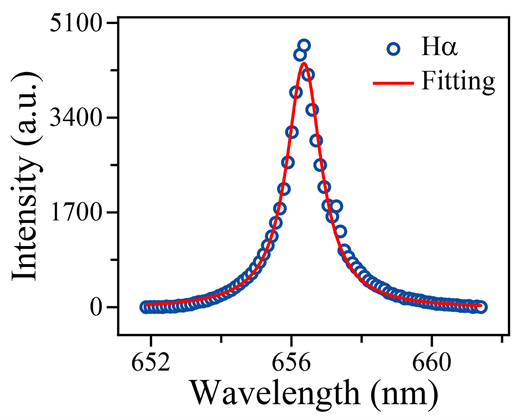
如图3所示,通过Lorentz曲线拟合得到Hα谱线的FWHA,通过式(19)计算出电子数密度Ne为1.44 × 1017 cm−3。

Figure 3. Lorentz fitting of Hα 656.361 nm
图3. Hα 656.361 nm的Lorentz拟合
本文应用公式(13)和(14)以及Ca元素的原子线和离子线建立了铁观音茶叶的等离子体的Saha-Boltzmann图,如图4所示。由公式(14)可知,Saha-Boltzmann图斜率包含着等离子体的温度信息,所得的T = 8161 ± 370 K。

Figure 4. Saha-Boltzmann plot of Ca element in Tieguanyin tea
图4. 铁观音茶叶中Ca元素的Saha-Boltzmann图
3.3. CN分子的振动温度和转动温度
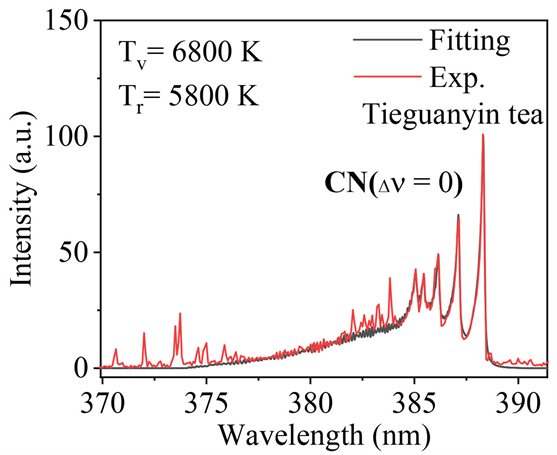
本文使用LIFBASE软件对位于381~389 nm范围内的CN ( )跃迁的光谱进行模拟,结果如图5所示。其中,红色谱线为实验中获得的光谱图,黑色谱线是LIFBASE软件拟合的结果,可见,两者非常吻合。通过模拟,得到CN分子的振动温度(Tv)和转动温度(Tr)分别为6800 K和5800 K。和等离子体温度T进行比较发现,它们满足关系T > Tv > Tr。这是因为,Ca的谱线产生于等离子演化的前期,且位于等离子体的中心区域,应用Ca元素特征谱线计算得到的T较高。而CN自由基产生于等离子体演化的后期,且产生于等离子体外围区域 [19] [34] ,因此会得到较低的温度Tv和Tr。

Figure 5. Simulation and experimental results of CN ( ) molecules in Tieguanyin tea
图5. 铁观音茶叶中CN ( )分子的模拟与实验结果
4. 结论
本文通过对铁观音茶的LIBS光谱进行分析,发现实验中所用的铁观音茶叶含有Ca、Na、Mg、K、Fe、Cu、Zn、Mn、Sr、Al、Li和Ba等元素,其中还探测到了C、N、H和O以及CN和C2分子的谱线。其次,对激光诱导下铁观音茶叶产生的等离子体特性进行了研究,包括等离子体温度(T)、振动温度(Tv)、转动温度(Tr)以及电子数密度(Ne)。通过对Hα谱线进行洛伦兹拟合获得Ne为1.44 × 1017 cm−3,通过建立Ca元素的Saha-Boltzmann图,计算得T为8161 ± 370 K。最后,使用LIFBASE软件对CN ( )分子进行模拟,获得Tv和Tr分别为6800 K和5800 K,且这三个温度在实验中满足关系T > Tv > Tr。
文章引用
李静文. 铁观音茶叶激光诱导等离子体特性研究
Study on the Characteristics of Laser-Induced Plasma in Tieguanyin Tea[J]. 传感器技术与应用, 2023, 11(04): 332-341. https://doi.org/10.12677/JSTA.2023.114038
参考文献
- 1. Xu, Y.Q., Chen, S.Q., Shen, D.Y. and Yin, J.F. (2011) Effects of Chemical Components on the Amount of Green Tea Cream. Agricultural Sciences in China, 10, 969-974. https://doi.org/10.1016/S1671-2927(11)60083-7
- 2. Sun, J.W., Hu, G.R., Liu, K.K., et al. (2019) Potential Exposure to Metals and Health Risks of Metal Intake from Tieguanyin Tea Production in Anxi, China. Environmental Geochemistry and Health, 41, 1291-1302. https://doi.org/10.1007/s10653-018-0212-y
- 3. Cao, Q.Q., Fu, Y.Q., Wang, J.Q., et al. (2021) Sensory and Chemical Characteristics of Tieguanyin Oolong Tea after Roasting. Food Chemistry: X, 12, Article ID: 100178. https://doi.org/10.1016/j.fochx.2021.100178
- 4. Wu, H., Hou, D.Y., Hui, R.H., et al. (2013) Lead Chrome Green Determination in Tea by Inductive Coupled Plasma Atomic Emission Spectrometry. Journal of Anshan Normal Univer-sity, 15, 41-43.
- 5. Tokalioglu, S. (2012) Determination of Trace Elements in Commonly Consumed Medicinal Herbs by ICP-MS and Multivariate Analysis. Food Chemistry, 134, 2504-2508. https://doi.org/10.1016/j.foodchem.2012.04.093
- 6. Li, X.L., Zhou, R.Q., Sun, C.J., et al. (2017) Detection of Lead Chrome Green Illegally Added in Tea Based on Confocal Raman Spectroscopy. Spectroscopy and Spectral Analysis, 37, 461-466.
- 7. Li, X.L., Xu, K.W., Zhang, Y.Y., Sun, C.J. and He, Y. (2017) Optical Determination of Lead Chrome Green in Green Tea by Fourier Transform Infrared (FT-IR) Transmission Spectroscopy. PLOS ONE, 12, e0169430. https://doi.org/10.1371/journal.pone.0169430
- 8. Shi, J.E., Hua, L., Li, Y.Q., et al. (2019) Determination of Lead Chrome Green in Tea by Ion Chromatography and Spectrophotometry. Journal of Food Safety and Quality, 10, 1534-1540.
- 9. Guo, X.H., Zhao, P., Wu, Y.Q., et al. (2022) Application of XRF and ICP-MS in Elements Content Determinations of Tieguanyin of Anxi and Hua’an County, Fujian Province. Spectroscopy and Spectral Analysis, 42, 3124-3129.
- 10. Nasrazadani, S. and Namduri, H. (2006) Study of Phase Transformation in Iron Oxides Using Laser Induced Breakdown Spectroscopy. Spectrochimica Acta Part B: Atomic Spectroscopy, 61, 565-571. https://doi.org/10.1016/j.sab.2006.04.001
- 11. 刘烨坤. 激光诱导击穿土壤重金属光谱增强及定量分析方法研究[D]: [硕士学位论文]. 太原: 中北大学, 2022.
- 12. Zhang, Q.H., Liu, Y.Z., Yin, W.Y., et al. (2020) The in situ De-tection of Smoking in Public Area by Laser-Induced Breakdown Spectroscopy. Chemosphere, 242, Article ID: 125184. https://doi.org/10.1016/j.chemosphere.2019.125184
- 13. Ding, Y., Xia, G.Y., Ji, H.W. and Xiong, X. (2019) Ac-curate Quantitative Determination of Heavy Metals in Oily Soil by Laser Induced Breakdown Spectroscopy (LIBS) Combined with Interval Partial Least Squares (IPLS). Analytical Methods, 11, 3657-3664. https://doi.org/10.1039/C9AY01030K
- 14. Tian, Y., Chen, Q., Lin, Y.Q., et al. (2021) Quantitative Determination of Phosphorus in Seafood Using Laser-Induced Breakdown Spectroscopy Combined with Machine Learning. Spectro-chimica Acta Part B: Atomic Spectroscopy, 175, Article ID: 106027. https://doi.org/10.1016/j.sab.2020.106027
- 15. Teng, G., Wang, Q.Q., Yang, H.F., et al. (2020) Pathological Iden-tification of Brain Tumors Based on the Characteristics of Molecular Fragments Generated by Laser Ablation Combined with a Spiking Neural Network. Biomedical Optics Express, 11, 4276-4289. https://doi.org/10.1364/BOE.397268
- 16. Singh, J.P. and Thakur, S.N. (2020) Laser-Induced Breakdown Spec-troscopy. Elsevier, Amsterdam.
- 17. 陈宇. 基于激光光谱技术的大气硫化物在线探测[D]: [硕士学位论文]. 南京: 南京信息工程大学, 2022.
- 18. 何亚雄, 周文琦, 柯川, 等. 激光诱导击穿光谱技术在气体检测中的研究综述[J]. 光谱学与光谱分析, 2021, 41(9): 2681-2687.
- 19. Dietz, T., Kohns, P. and Ankerhold, G. (2018) Diagnostics and Simulations of Molecular Formation in Laser-Induced Plasmas. Spectrochimica Acta Part B: Atomic Spectroscopy, 148, 51-59. https://doi.org/10.1016/j.sab.2018.06.007
- 20. Kramida, A., Ralchenko, Y., Reader, J., et al. (2022) NIST Atomic Spectra Database (Version 5.10). National Institute of Standards and Technology, Gaithersburg.
- 21. Gondal, M.A., Habibullah, Y.B., Baig, U. and Oloore, L.E. (2016) Direct Spectral Analysis of Tea Samples Using 266nm UV Pulsed Laser-Induced Breakdown Spectroscopy and Cross Validation of LIBS Results with ICP-MS. Talanta, 152, 341-352. https://doi.org/10.1016/j.talanta.2016.02.030
- 22. Rehan, I., Gondal, M.A., Aldakheel, R.K., et al. (2022) Determination of Nutritional and Toxic Metals in Black Tea Leaves Using Calibration Free LIBS and ICP: AES Tech-nique. Arabian Journal for Science and Engineering, 47, 7531-7539. https://doi.org/10.1007/s13369-021-06233-y
- 23. Lu, X., Liu, Y.Z., Zhang, Q.H. and Li, L. (2020) Study on Tea Harvested in Different Seasons Based on Laser-Induced Breakdown Spectroscopy. Laser Physics Letters, 17, Article ID: 015701. https://doi.org/10.1088/1612-202X/ab5c23
- 24. CabalíN, L.M., Delgado, T., Garcia-Gomez, L. and Laserna, J.J. (2020) Considerations on Formation Mechanisms of Emitting Species of Organic and C-Containing Inorganic Com-pounds in CO2 Atmosphere Using Laser-Induced Breakdown Spectroscopy as a Strategy for Detection of Molecular Solids. Spectrochimica Acta Part B: Atomic Spectroscopy, 169, Article ID: 105869. https://doi.org/10.1016/j.sab.2020.105869
- 25. Zhang, Q., Liu, Y., Yin, W., et al. (2020) The Online Detection of Carbon Isotopes by Laser-Induced Breakdown Spectroscopy. Journal of Analytical Atomic Spectrometry, 35, 341-346. https://doi.org/10.1039/C9JA00384C
- 26. Zhangcheng, Y.Z., Liu, Y.Z., Saleem, S., et al. (2020) Online in situ Detection and Rapid Distinguishing of Saffron. Journal of Laser Applications, 32, Article ID: 032020. https://doi.org/10.2351/7.0000137
- 27. Civis, M., Civis, S., Sovova, K., et al. (2011) Laser Ablation of FOX-7: Proposed Mechanism of Decomposition. Analytical Chemistry, 83, 1069-1077. https://doi.org/10.1021/ac1028769
- 28. Wang, J.M., Zheng, P.C., Liu, H.D. and Fang, L. (2016) Classification of Chinese Tea Leaves Using Laser-Induced Breakdown Spectroscopy Combined with the Discriminant Analysis Method. Analytical Methods, 8, 3204-3209. https://doi.org/10.1039/C5AY03260A
- 29. Portnov, A., Rosenwaks, S. and Bar, I. (2003) Emission following Laser-Induced Breakdown Spectroscopy of Organic Compounds in Ambient Air. Applied Optics, 42, 2835-2842. https://doi.org/10.1364/AO.42.002835
- 30. Yan, Y.H., Liu, Y.Z., Zhang, Q.H. and Ding, P.F. (2020) Correlation between Laser-Induced Plasma Temperature and CN Radical Molecule Emission during Tree Burning. Optik, 224, Article ID: 165670. https://doi.org/10.1016/j.ijleo.2020.165670
- 31. Ciucci, A., Corsi, M., Palleschi, V., et al. (1999) New Procedure for Quantitative Elemental Analysis by Laser-Induced Plasma Spectroscopy. Applied Spectroscopy, 53, 960-964. https://doi.org/10.1366/0003702991947612
- 32. Tognoni, E., Cristoforetti, G., Legnaloli, S., et al. (2007) A Nu-merical Study of Expected Accuracy and Precision in Calibration-Free Laser-Induced Breakdown Spectroscopy in the Assumption of Ideal Analytical Plasma. Spectrochimica Acta Part B: Atomic Spectroscop, 62, 1287-1302. https://doi.org/10.1016/j.sab.2007.10.005
- 33. Gigosos, M.A., Gonzalez, M.A. and Cardenoso, V. (2003) Com-puter Simulated Balmer-α, -β and -γ Stark Line Profiles for Non-Equilibrium Plasmas Diagnostics. Spectrochimica Acta Part B: Atomic Spectroscop, 58, 1489-1504. https://doi.org/10.1016/S0584-8547(03)00097-1
- 34. Gaft, M., Nagli, L., Gornushkin, I. and Raichlin, Y. (2020) Review on Recent Advances in Analytical Applications of Molecular Emission and Modelling. Spectrochimica Acta Part B: Atomic Spectroscopy, 173, Article ID: 105989. https://doi.org/10.1016/j.sab.2020.105989