Journal of Water Resources Research
Vol.05 No.02(2016), Article ID:17205,7
pages
10.12677/JWRR.2016.52018
The Study on the Wastewater Sampling Location of Water Pollution Source Monitoring
Quan Zou1, Hongyan Nan2
1Wushan Water Affairs Bureau, Chongqing
2Chongqing University, Chongqing

Received: Feb. 27th, 2016; accepted: Mar. 15th, 2016; published: Mar. 24th, 2016
Copyright © 2016 by authors and Hans Publishers Inc.
This work is licensed under the Creative Commons Attribution International License (CC BY).
http://creativecommons.org/licenses/by/4.0/


ABSTRACT
Wastewater samples are a key link in the process of contaminants determination, and only the sampling process gets a representative sample, can the data be valuable. Therefore, sampling location has significant effect on sampling representative. This paper researches the spatial distribution of typical pollutants in wastewater in different flow states with the relative error method, in order to study the effect of sampling location for sampling representativeness. The results show that the pollutant distribution in laminar state is more heterogeneous than in turbulent state, and there will be more error in laminar flow condition; besides, multipoint samples need to be mixed for obtaining representative samples in the laminar state, which undoubtedly makes workload and difficulty of sampling increase, and is not conducive to field sampling. However, no matter which water layer, sampling in turbulent state can get closer results, and will not produce larger deviation. Therefore, according to the results of this research, turbulent section is preferred in the choice of wastewater sampling location, and avoids laminar flow section. This research is consistent with other research results, and can provide theoretical guidance for the choice of wastewater sampling location.
Keywords:Sampling Location, Section, Laminar Flow, Turbulence

污染源监测中的废水现场采样位置研究
邹泉1,南红岩2
1巫山县水务局,重庆
2重庆大学,重庆

收稿日期:2016年2月27日;录用日期:2016年3月15日;发布日期:2016年3月24日

摘 要
废水样品采集是污染物含量测定的关键环节,只有保证采样过程得到有代表性的样品,才能确保测定的数据具有使用价值,因此,研究采样位置对采样代表性的影响具有重要意义。本文用相对误差法对废水典型污染物在不同流态下的空间分布作了研究。研究结果表明,层流状态污染物分布比湍流状态污染物分布更加具有不均匀性,简单的层流状态下取样得出的结果误差较大,要在层流状态下采得有代表性的样品,需多点采样混合,这就无疑使得采样工作量和难度都会增加,不利于现场的采样,而在湍流状态下采样,不管在哪层采样,均可获得较为接近的结果,不会产生较大的偏差。因此,根据本次研究结果,废水采样过程中采样位置优选湍流断面,避免层流断面。本研究与其它相关研究结果吻合,能为废水采样位置的选择提供理论指导。
关键词 :采样位置,断面,层流,湍流

1. 引言
废水污染源是造成水域环境污染的污染物发生源 [1] 。在具有代表性的时间,地点,按规定的采集要求采集水样,才能准确反映实际的污染情况。在ISO 5667-1-2006《Guidance on the design of sampling programmers and sampling techniques》关于废水采样位置有如下明确的规定:“采样位置应选择有大的湍流位置,以确保良好的混合。在缺乏湍流条件的排污口,应设置障碍或堰将层流引成湍流进行采样。一旦采样断面确立以后,应设置标识以确保可再现的采样条件 [2] 。”而且,在ISO 5667-10-1992《Guidance on sampling of waste waters》中再次对废水采样位置作了强调:“水流状态可以在层流和湍流之间进行转换。理想状态下,除了容易被湍流改变浓度的溶解气体和易挥发成分的采样以外,其他污染物采样都应该从充分混合的湍流水体中,或者将层流引成湍流进行 [3] 。”在HJ495-2009《水质采样方案设计规定》中要求“应从充分混合的湍流中取样最为理想” [4] 。而相关采样规范只要求要固定采样位置,但固定在什么位置采样并未作明确的规定。采样点位的选择就是要选择一个采样点位的坐标,在这样的采样点位采样所获取的水样更能代表该采样点所在断面的废水总体水质。
王利加等 [5] 利用模糊数学理论中的模糊聚类分析方法表明,采样点位不宜选择在水流流态较稳定的断面,而应选择在水流较湍急的断面。朱焕山等 [6] 用同样的方法分析表明采样点应选择水跃区内某一断面为监测断面,以保证水中有机物质相对较为均匀。赵国华等 [7] 也用模糊聚类分析方法得出B断面(由于管道跌水而造成的流速增加,又处在转弯引起的湍流流态)作为采样断面测出的结果较为理想。
以上针对废水采样位置的相关研究,均利用模糊聚类分析的模糊数学理论对采样位置进行研究,均得出湍流流态下测得的水样更具有代表性,本研究为了探究采样位置对采样代表性的影响,利用相对误差法对废水典型污染物在不同流态下的空间分布作了研究。相对误差法是在同一断面上从横、纵向设多个点位进行多次同步监测,分别计算均值假定为真值,然后计算相对误差,最后用相对误差即各点位与均值之间符合程度来研究各种污染物在废水中的分布规律 [8] 。本次研究也将为水体污染源废水采样位置的选择提供一定的参考价值。
2. 研究方法
实验选择同一排污口的不同流态下A、B两个断面(A断面位于清水池出口转弯处后,代表湍流状态断面,B断面位于直流管段处,代表层流状态断面),每个断面在垂直方向分为三层,在水平方向分为三段,一共九个点(见图1),对COD和氨氮进行同步采样分析,各个采样位置均采样四次。此次分层分段对COD和氨氮进行取样,使得采集到的废水污染物样品有一定的空间代表性,符合此类污染物在废水中空间分布规律,具有一定的科学性。此外,为保证实验条件的一致性,相同分析项目均采用同一台仪器同一分析人员进行测试。
3. 结果与讨论
3.1. 不同采样点对COD测试结果的影响
表1和表2分别是某化工厂A断面(湍流状态断面)和B断面(层流状态断面)四次取样COD的测试结果,表中B断面四次取样各个取样点波动明显大于A断面。图2是A、B两断面9个取样位置COD平均值的比较,结果表明,B断面,即层流状态断面的标准偏差大于A断面(湍流状态断面),经计算,A断面四次测定结果的相对标准偏差范围是4.47%~6.68%,而B断面四次测定结果的相对标准偏差范围是10.2%~36.0%,显然,A断面的取样结果优于B断面。
为了进一步证明湍流状态断面(A断面)的测定结果较好,本次研究又选取了某污水处理厂具有与化工厂同样性质的断面进行COD的测定,测定结果如表3、表4、图3所示。表3和表4表明:A断面的COD测定结果波动性比B断面小;图3表明A断面四次取样的标准偏差远低于B断面,经计算,A断面四次COD测定的相对标准偏差在4.50%~6.93%之间波动,而B断面相对标准偏差在11.5%~52.8%之间波动。即湍流断面COD的测定结果比层流断面测定结果好。
3.2. 不同采样点对氨氮测试结果的影响
表5和表6分别是某化工厂A断面(湍流状态断面)和B断面(层流状态断面)四次取样氨氮的测试结果,表中B断面四次取样各个取样点波动略大于A断面。图4是A、B两断面9个取样位置氨氮平均值的比较,结果表明,B断面,即层流状态断面的标准偏差均大于A断面(湍流状态断面),经计算,A断面四次测定结果的相对标准偏差范围是5.43%~7.43%,而B断面四次测定结果的相对标准偏差范围是6.61%~8.43%,显然,A断面的取样结果略优于B断面。
为了进一步证明湍流状态断面(A断面)的测定结果较好,本次研究又选取了某污水处理厂具有与化工厂同样性质的断面进行氨氮的测定,测定结果如表7、表8和图5所示。表7和表8表明:A断面的氨氮测定结果波
动性明显比B断面小;图5表明A断面四次取样的标准偏差低于B断面,经计算,A断面四次氨氮测定的相对标准偏差在4.18%~7.54%之间波动,而B断面相对标准偏差在7.05%~13.8%之间波动。即湍流断面氨氮的测定结果比层流断面测定结果好。
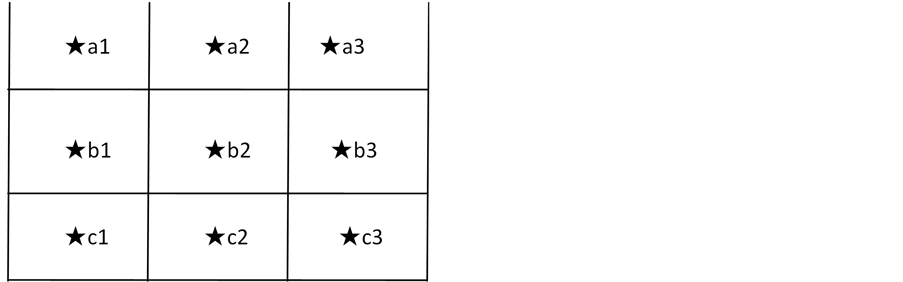
Figure 1. The sampling points schematic diagram
图1. 采样布点示意图
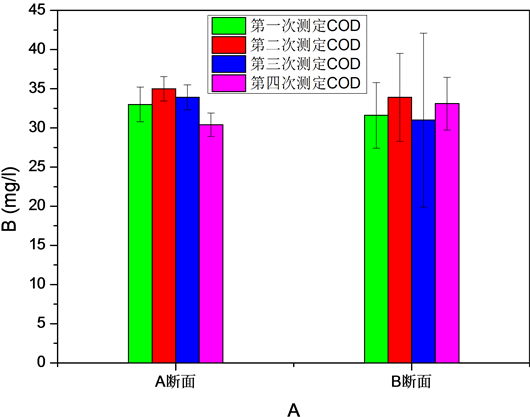
Figure 2. COD test results comparison of four samples in Section A and B of certain chemical plant
图2. 某化工厂A、B断面四次取样COD测试结果比较
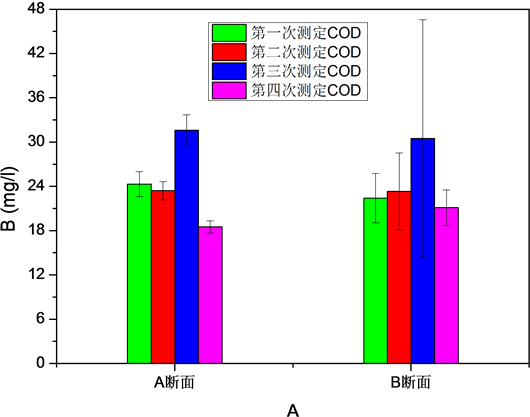
Figure 3. COD test results comparison of four samples in Section A and B of certain sewage treatment plant
图3. 某污水处理厂A、B断面四次取样COD测试结果比较
Table 1. COD test results of four samples in Section A of certain chemical plant
表1. 某化工厂A断面四次取样COD测试结果
Table 2. COD test results of four samples in Section B of certain chemical plant
表2. 某化工厂B断面四次取样COD测试结果
Table 3. COD test results of four samples in Section A of certain sewage treatment plant
表3. 某污水处理厂A断面四次取样COD测试结果
Table 4. COD test results of four samples in Section B of certain sewage treatment plant
表4. 某污水处理厂B断面四次取样COD测试结果
Table 5. NH3-N test results of four samples in Section A of certain sewage treatment plant
表5. 某化工厂A断面四次取样氨氮测试结果
Table 6. NH3-N test results of four samples in Section B of certain sewage treatment plant
表6. 某化工厂B断面四次取样氨氮测试结果
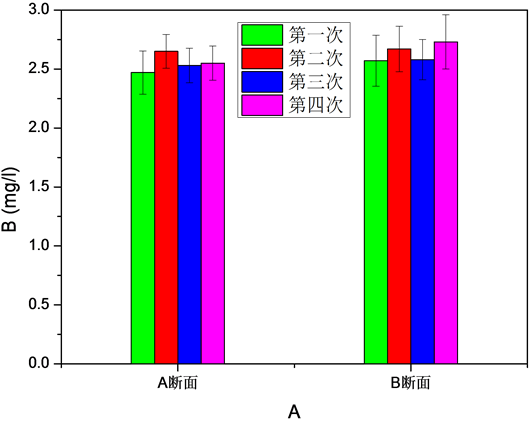
Figure 4. NH3-N test results comparison of four samples in Section A and B of certain chemical plant
图4. 某化工厂A、B断面四次取样氨氮测试结果比较
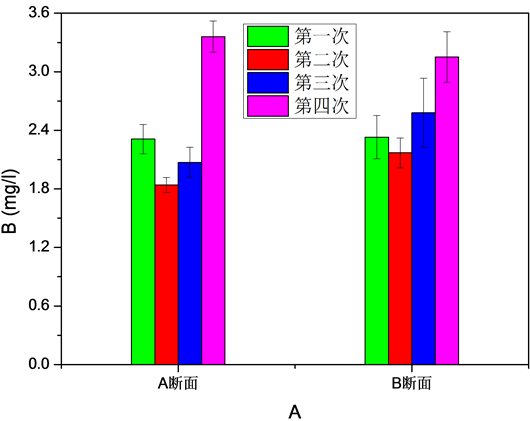
Figure 5. NH3-N test results comparison of four samples in Section A and B of certain sewage treatment plant
图5. 某污水处理厂A、B断面四次取样氨氮测试结果比较
Table 7. NH3-N test results of four samples in Section A of certain sewage treatment plant
表7. 某污水处理厂A断面四次取样氨氮测试结果
Table 8. NH3-N test results of four samples in Section B of certain sewage treatment plant
表8. 某污水处理厂B断面四次取样氨氮测试结果
综上,无论是化工厂还是污水处理厂,B断面(直流管段处)中九个点污染物浓度的相对标准偏差总体趋势大于A断面(清水池出口转弯处后)中九个点污染物浓度的相对标准偏差。这就说明层流状态污染物分布比湍流状态污染物分布更加具有不均匀性,要在层流状态下采得有代表性的样品,需多点采样混合,这就无疑使得采样工作量和难度都会增加,不利于现场的采样,而在湍流状态下采样,不管在哪层采样,均可获得较为接近的结果,不会产生较大的偏差。因此,采样过程中优选湍流断面。
基金项目
中央高校基金(项目号:CDJZR14215501)。
文章引用
邹 泉,南红岩. 污染源监测中的废水现场采样位置研究
The Study on the Wastewater Sampling Location of Water Pollution Source Monitoring[J]. 水资源研究, 2016, 05(02): 143-149. http://dx.doi.org/10.12677/JWRR.2016.52018
参考文献 (References)
- 1. 国家环保总局《水和废水监测分析方法》编委会. 水和废水监测分析方法[M]. 第4版. 北京: 中国环境科学出版社, 2002: 38-47. The State Environmental Protection Administration The Water and Wastewater Monitoring Analysis Method Editorial Board. Water and Wastewater monitoring analysis method. 4th Edition. Beijing: China Environmental Science Press, 2002: 38-47. (in Chinese)
- 2. ISO 5667-1-2006 Water Quality—Sampling—Part 1: Guidance on the design of sampling programmes and sam-pling techniques.
- 3. ISO 5667-10-1992 Water Quality—Sampling—Part 10: Guidance on sampling of waste waters.
- 4. 中华人民共和国国家环境保护标准(HJ495-2009): 水质采样方案设计技术规定[S]. 北京: 中国环境科学出版社, 2009. The state environmental protection standards of the People’s Republic of China (HJ495-2009): Water quality-technical regulation on the design of sampling programmers. Beijing: China Environmental Science Press, 2009. (in Chinese)
- 5. 王利加, 杨钰. 废水采样点位优化研究[J]. 辽宁城乡环境科技, 1998, 18(6): 59-62. WANG Lijia, YANG Yu. The optimization research of sampling in waste water. Liaoning Urban and Rural Environmental Science and Technology, 1998, 18(6): 59-62. (in Chinese)
- 6. 朱焕山, 王红军. 啤酒行业废水COD分布及采样点位优化研究[J]. 环境保护科学, 2001, 108(27): 31-33. ZHU Huanshan, WANG Hongjun. Study on distribution and optimization of sampling sites with COD in brewery wastewater. Environmental Protection Science, 2001, 108(27): 31-33. (in Chinese)
- 7. 赵国华, 赵贞姬, 荆万钧, 王子玲. 关于废水监测断面及采样点位选择的探讨[J]. 中国环境监测, 1999, 15(5): 7-10. ZHAO Guohua, ZHAO Zhenji, JIN Wanjun and WANG Ziling. The selection of monitoring section and sample point in wastewater. Environmental monitoring in China, 1999, 15(5): 7-10. (in Chinese)
- 8. 佟敬军, 赵贞姬. 化学需氧量在造纸废水中分布规律及采样点位的优化[J]. 环境监测管理与技术, 1999, 11(5): 16-19. TONG Jingjun, ZHAO Zhenji. Distribution law of COD and optimization of sampling in waste water from paper plant. The Administration and Technique of Environmental Monitoring, 1999, 11(5): 16-19. (in Chinese)