Statistical and Application
Vol.04 No.03(2015), Article ID:16003,7 pages
10.12677/SA.2015.43018
The Scale Dependence of the Local Moran’s I
Jinjie Feng*, Huiguo Zhang, Xijian Hu#
College of Mathematics and System Sciences, Xinjiang University, Urumuqi Xinjiang
*第一作者。
#通讯作者。
Email: 957725767@qq.com, #xijianhu@126.com
Received: Aug. 16th, 2015; accepted: Sep. 5th, 2015; published: Sep. 8th, 2015
Copyright © 2015 by authors and Hans Publishers Inc.
This work is licensed under the Creative Commons Attribution International License (CC BY).
http://creativecommons.org/licenses/by/4.0/


ABSTRACT
The paper focuses on the calculation formula of local Moran’s I, and uses three standardized processing methods to construct different spatial distance weighted matrix by choosing different scale d, thus the corresponding values of local Moran’s I are obtained. Lately, the significance testing of local Moran’s I is proceeded based on changeable scales, and the testing result is positive. So, the values local Moran’s I are dependent on scale.
Keywords:Local Moran’s I, Spatial Distance Weighted Matrix, Standardized Methods, Scale Dependence

局部Moran’s I的尺度依赖性
冯金杰*,张辉国,胡锡健#
新疆大学数学与系统科学学院,新疆 乌鲁木齐
Email: 957725767@qq.com, #xijianhu@126.com
收稿日期:2015年8月16日;录用日期:2015年9月5日;发布日期:2015年9月8日

摘 要
文章针对局部Moran’s I值的计算公式,通过选取不同的尺度d,采用三种不同的标准化处理方法构造出不同的空间距离权重矩阵,求得相应的局部Moran’s I值。最后基于尺度的变化,对局部Moran’s I值进行显著性检验,检验结果表明尺度变化对局部Moran’s I值的变化的影响是显著的,证明了局部Moran’s I的值对尺度具有依赖性。
关键词 :局部Moran’s I,空间距离权重矩阵,标准化方法,尺度依赖性

1. 引言
随着应用的深入,空间自相关性分析逐渐成为人们关注的重点,因而产生了许多用来度量空间自相关性的参数,而在这些参数中,Moran’s I是出现最早、应用最广的一个度量参数。Moran’s I指数是由Moran于1950年首先提出的,经过广大学者的努力,特别是Anselin [1] 提出空间局部自相关分析方法,包括局部Moran’s I指数和Moran散点图。Tobler (1970)曾提出地理学第一定律:“任何事物与其它事物都是有联系的,并且距离越近联系就越密切”。空间自相关是空间统计学的重要研究领域,也是研究空间地理单元之间分布关联性的核心理论方法之一[2] [3] 。
空间自相关是指同一个变量在不同空间位置上的相关性。空间现象具有自相关性,空间位置上越靠近的现象就越相似。空间自相关的度量方法可以分为全局空间自相关和局部空间自相关。局部Moran’s I的高值表示具有相似变量值的面积单元的空间聚集(可以是高或低),而局部Moran’s I的低值说明不相似值的空间单元的空间聚集[4] [5] 。
由于研究区域的面积单元是可变的或可修改的,即研究区域的面积单元的尺度是可以变化的,因而随着尺度的变化所得到的统计结果也是有差异的[6] 。所以使用不同的尺度对数据进行模拟分析,可以得到从微观到宏观不同详细程度的信息 [7] [8] 。所以需要通过计算不同尺度下的局部Moran’s I值及它们的显著性水平来选择合适的尺度。最优的区域方案往往是以数据的可得性和统计区域的划分为前提的,在综合显示数据的空间变化时,需慎重考虑区域的尺度选择。
2. 空间距离权重矩阵标准化的定义及其影响
空间距离权重矩阵的定义 [9] 如下:

空间距离权重矩阵为:

对P进行标准化的三种定义 [10] 如下:
定义1 (The row-sum standardized W-coding scheme):


定义2 (The globally standardized C-coding scheme):


定义3 (The variance stabilizing S-coding scheme)


则对应的局部Moran’s I的值如下: 本文选用13*13的网格,并把它分成了9块小的区域(见图1),它们的顺序依次为(按从左往右)为区域a:4*7服从N(0,
1),区域b:4*3服从N(2, 1),区域c:4*3服从N(0, 1),区域d:5*5服从N(3, 1),区域e:5*6服从N(0.5, 1),区域f:5*2服从N(1,
1),区域g:4*6服从N(2, 1),区域h:4*3服从N(0, 1),区域i:4*4服从N(3, 1)。然后在同一尺度下采用上述三种标准化方法进行模拟。通过模拟结果可以发现:在这169个点中的任何一点的Moran’s
I值中,三种标准化方法对应的Moran’s I值的正负都是相同的。
本文选用13*13的网格,并把它分成了9块小的区域(见图1),它们的顺序依次为(按从左往右)为区域a:4*7服从N(0,
1),区域b:4*3服从N(2, 1),区域c:4*3服从N(0, 1),区域d:5*5服从N(3, 1),区域e:5*6服从N(0.5, 1),区域f:5*2服从N(1,
1),区域g:4*6服从N(2, 1),区域h:4*3服从N(0, 1),区域i:4*4服从N(3, 1)。然后在同一尺度下采用上述三种标准化方法进行模拟。通过模拟结果可以发现:在这169个点中的任何一点的Moran’s
I值中,三种标准化方法对应的Moran’s I值的正负都是相同的。

Figure 1. The regional distribution picture
图1. 区域分布图
这说明了不论采取哪一种标准化方法,若该区域的Moran’s I为高值则在上述三种标准化处理之下同为高值,表示都具有相似变量值的面积单元的聚集(可以是高或低),若该区域的Moran’s
I为低值则同为低值,表示都具有相不似变量值的面积单元的聚集。但是这三种定义对应的局部Moran’s I值也有一些小的差异,在每一个点处, 是最大的,
是最大的, 是最小的,
是最小的, 处于二者之间。因此标准化方法S-coding是标准化方法W-coding与标准化方法C-coding的一个综合,所以在对空间矩阵进行标准化时应该首先考虑选S-coding进行处理。
3. 对模拟结果进行显著性检验
定义(局部Moran’s I的期望和方差)
期望:

方差:

其中:


则对其进行正态标准化有:

同理可得另外两种:

经化简后可得: ,即在同一尺度下它们的P值是相同的,我们取a
= 0.05,d从2到32以步长6递增,显著性如下图2~7。
,即在同一尺度下它们的P值是相同的,我们取a
= 0.05,d从2到32以步长6递增,显著性如下图2~7。
从模拟结果可以发现从d = 2到d = 8的变化过程中显著性是逐渐增强的,从d = 8到d = 32的变化过程中显著性逐渐减弱,所以我们选择合适的d应该在8左右。从上述结果可以看出,在用局部Moran’s I进行空间相关性分析时,由于尺度选取的不同会对结果产生比较显著的差异,如果尺度选取过大就会丢失一些重要的细节,如果尺度选取过小就无法完全对来自不同空间单元的数据进行比较。
4. 结论
局部Moran’s I值主要反应了空间单元面积与其邻近单元面积之间的相似程度,并且它与尺度的选取有着密切的关系。模拟结果显示标准化方法S-coding是标准化方法W-coding与C-coding的一个综合,
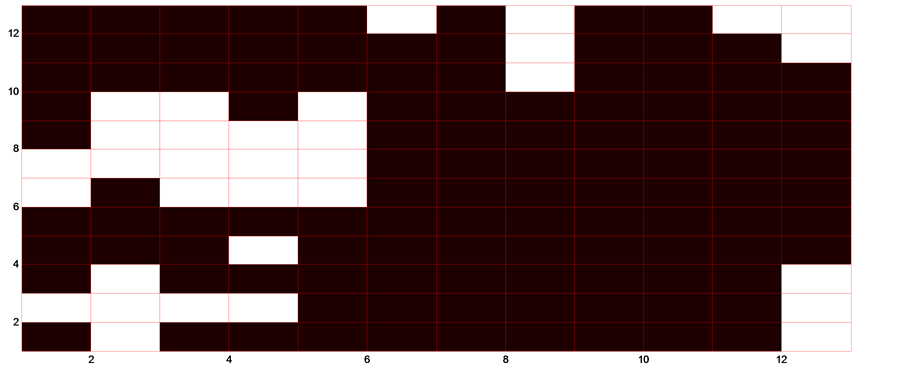
Figure 2. The significance of Local Moran’s I when d equals to 2 units length
图2. 距离d为两个单位长度时的局部Moran’s I显著性

Figure 3. The significance of Local Moran’s I when d equals to 8 units length
图3. 距离d为八个单位长度时的局部Moran’s I显著性

Figure 4. The significance of Local Moran’s I when d equals to 14 units length
图4. 距离d为十四个单位长度时的局部Moran’s I显著性

Figure 5. The significance of Local Moran’s I when d equals to 20 units length
图5. 距离d为二十个单位长度时的局部Moran’s I显著性
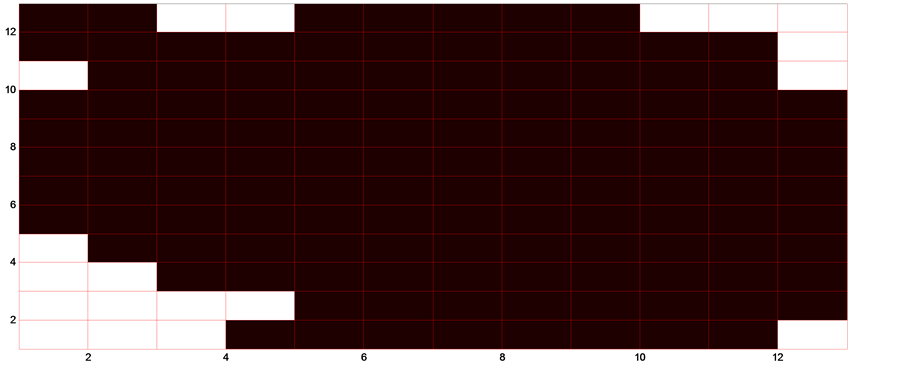
Figure 6. The significance of Local Moran’s I when d equals to 26 units length
图6. 距离d为二十六个单位长度时的局部Moran’s I显著性
Figure 7. The significance of Local Moran’s I when d equals to 32 units length
图7. 距离d为三十二个单位长度时的局部Moran’s I显著性
所以在对空间矩阵进行标准化时应该首先考虑S-coding。检验结果表明选取不同的尺度所得到的结果有明显的差异。因此在用局部Moran’s I值进行空间自相关性检验时,需慎重考虑区域尺度的选择。
基金项目
国家自然科学基金(41261087),教育部青年基金(12XJJC910001),新疆文科基地重大项目基金(0601920)。
文章引用
冯金杰,张辉国,胡锡健. 局部Moran’s I的尺度依赖性
The Scale Dependence of the Local Moran’s I[J]. 统计学与应用, 2015, 04(03): 162-168.
http://dx.doi.org/10.12677/SA.2015.43018
参考文献 (References)
- 1. Anselin, L. (1995) Local indicators of spatial association—LISA. Geographical Analysis, 27, 93-115. http://dx.doi.org/10.1111/j.1538-4632.1995.tb00338.x
- 2. Cliff, A.D. and Ord, J.K. (1972) Testing for spatial autocorrelation among regression residuals. Geographical Analysis, 4, 267-284. http://dx.doi.org/10.1111/j.1538-4632.1972.tb00475.x
- 3. Ord, J.K. and Getis, A. (2001) Testing for local spatial autocorrelation in the presence of global autocorrelation. Regional Science, 41, 411-432.
- 4. Assuncao, R. and Reis, E. (1999) A new proposal to adjust Moran’s I for population density. Statistic in Medicine, 18, 2147-2162. 3.0.CO;2-I>http://dx.doi.org/10.1002/(SICI)1097-0258(19990830)18:16<2147::AID-SIM179>3.0.CO;2-I
- 5. Cliff, A.D. and Ord, J.K. (1981) Spatial processes: Models and applications. London.
- 6. 李海萍 (2009) 空间统计分析中的MAUP及其影响. 统计与决策, 22, 15-17.
- 7. Tiefelsdorf, M. (1998) Some practical applications of Moran’s I exact conditional distribution. Papers in Regional Science.
- 8. Tiefelsdorf, M. and Boots, B.N. (2005) The exact distribution of Moran’s I. Environment and Planning, 27, 985-999.
- 9. 徐彬 (2007) 空间权重矩阵对Moran’s I指数影响的模拟分析. 南京师范大学, 南京.
- 10. Tiefelsdorf, M. and Boots, B.N. (1997) A note on the extremities of local Moran’s I and their impact on global Moran’s I. Geographical Analysis, 29, 248-257. http://dx.doi.org/10.1111/j.1538-4632.1997.tb00960.x